
Both the S&P CoreLogic Case-Shiller indices and the Federal Housing Finance Agency's (FHFA's) House Price Index (HPI) were released on Tuesday. The Case-Shiller Indices showed prices generally slowing while FHFA's were more stable.
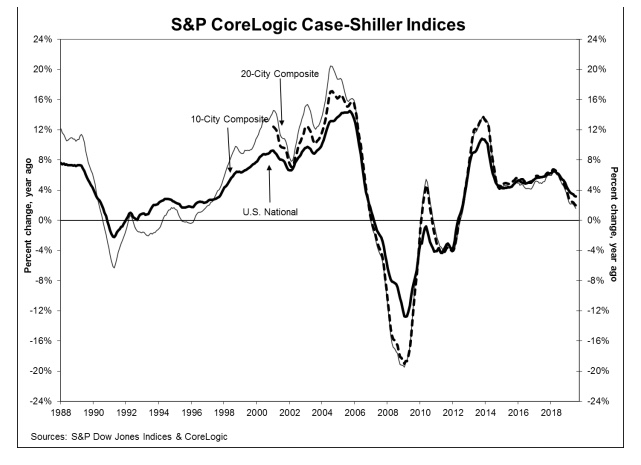
The Case-Shiller National Index, covering all nine U.S. census divisions, was up 3.2 percent on an annual basis in July, the same increase as reported in June. The seasonally adjusted index rose 0.1 percent month-over-month while the unadjusted version increased 0.4 percent.
Both of the city-based composite indices showed lower appreciation than in June. The 10-City Composite annual increase came in at 1.6 percent, down from 1.9 percent and the 20-City Composite's gains slipped from 2.2 percent to 2.0 percent. On an unadjusted basis the 10-City Index was unchanged, and the 20-City eked out a 0.1% increase for the month. After adjustment he 10-City Composite posted a 0.1% decline and the 20-City Composite was unchanged. Fifteen of the 20 cities reported increases both before and after seasonal adjustment.
Phoenix and Las Vegas remained in the one-two positions based on their annual increases. The Phoenix appreciation rate was 5.8 percent while Las Vegas prices rose 4.7 percent. Charlotte pushed Tampa out of third place in July with annual growth of 4.6 percent. Seven of the 20 cities reported greater price increases in the year ending July 2019 versus the year ending June 2019.
Philip Murphy Managing Director and Global Head of Index Governance at S&P Dow Jones Indices provided the following analysis. "Year-over-year home prices continued to gain, but at ever more modest rates. Charlotte surpassed Tampa to join the top three cities, and Seattle may be turning around from its recent negative streak of YOY price changes, improving from -1.3 percent in June to -0.06 percent in July.
"Overall, leadership remains in the southwest (Phoenix and Las Vegas) and southeast (Charlotte and Tampa). Other pockets of relative strength include Minneapolis, which increased its YOY gain to 4.2 percent, and Detroit, which is closely behind at 4.1 percent YOY. The 10-City and 20-City Composites both experienced lower YOY price gains than last month, declining to 1.6 percent and 2.0 percent respectively. However, the U.S. National Home Price NSA Index remained steady with a YOY price gain of 3.2 percent, the same as the prior month. Home price gains remained positive in low single digits in most cities, and other fundamentals indicate renewed housing demand. According to the National Association of Realtors, the YOY change in existing home sales was positive in July for the first time in a number of months, and housing supply tightened since peaking in June."
All three indices are higher than their previous peaks achieved in the summer of 2006. The National Index is up 4.7 percent, the 10-City Composite is 2.0 percent and the 20-City is 5.6 percent higher than their earlier numbers. .
The FHFA HPI was up 0.4 percent in July compared to its June level, double the May to June increase of 0.2 percent. On an annual basis prices rose 5.0 percent, the same annual increase as posted the previous month.
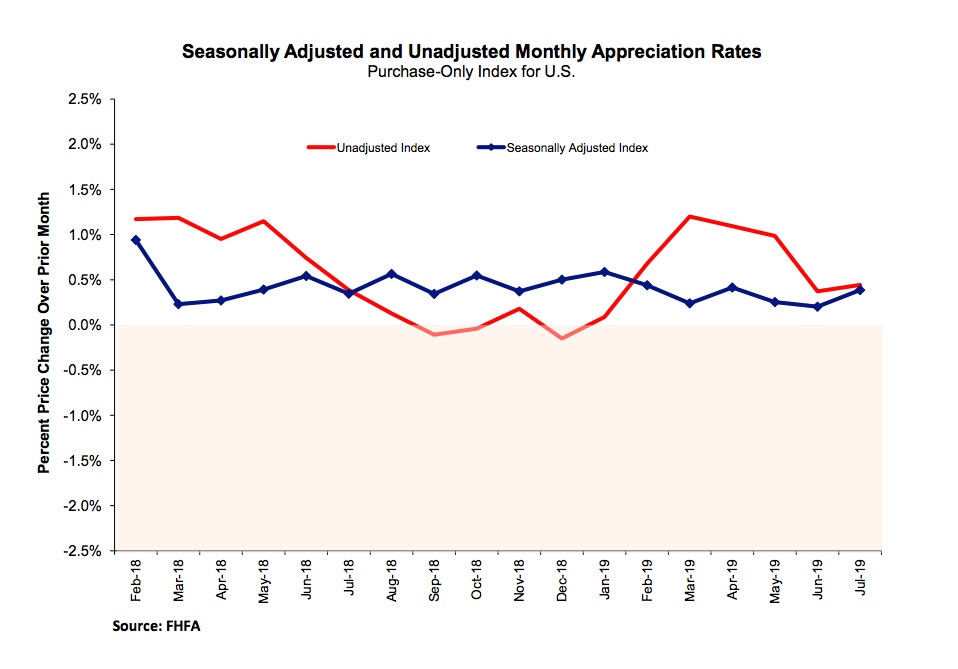
For the nine census divisions, seasonally adjusted monthly house price changes from June 2019 to July 2019 ranged from 0.1 percent in the Middle Atlantic division to 1.2 percent in the Mountain division. All but two divisions posted larger month-over-month increases than they did in June. The 12-month changes were all positive, ranging from 3.6 percent in the Middle Atlantic division to 7.6 percent in the Mountain division.
FHFA's HPI is derived from sales prices of homes financed by mortgages purchased or guaranteed by Freddie Mac or Fannie May. The index was benchmarked at 100 in January 1991. The current index value is 276.9.
The S&P CoreLogic Case-Shiller Home Price Indices are constructed to accurately track the price path of typical single-family home pairs for thousands of individual houses from the available universe of arms-length sales data. The National U.S. Home Price Index tracks the value of single-family housing within the United States. The indices have a base value of 100 in January 2000; thus, for example, a current index value of 150 translates to a 50 percent appreciation rate since January 2000 for a typical home located within the subject market.
As of July 2019, the National Index was at 211.72 up from 210.71 in June. The 10- and 20-City Composites had readings of 230.74 and 218.00 respectively, compared to 230.58 and 217.65 the prior month. Los Angeles has the highest index at 286.80 and Cleveland the lowest at 127.41.


