
The Census Bureau and the Department of Housing and Urban Development today released New Residential Home Sales survey data for November 2009.
The survey is primarily based on a sample of houses selected from building permits. Since a “sale” is defined as a deposit taken or sales agreement signed, this can occur prior to a permit being issued. Changes in sales price data reflect changes in the distribution of houses by region, size, etc., as well as changes in the prices of houses with identical characteristics. It takes four months to establish a trend of new home purchases
In last month's release, which reported on October survey data, sales of new single family houses rose 6.2% to a rate of 430,000 annual transactions, much better than the market's expectation for 410,000 annual sales and 25,000 units higher than the revised higher 405,000 pace reported in September. The estimate of new houses for sale at the end of October was 239,000. At that annual pace of sales, new home supply would last for 6.7 months. The median sales price of new houses sold in October 2009 was $212,200; the average sales price was $261,100.
In this month's survey, which reported on November data...
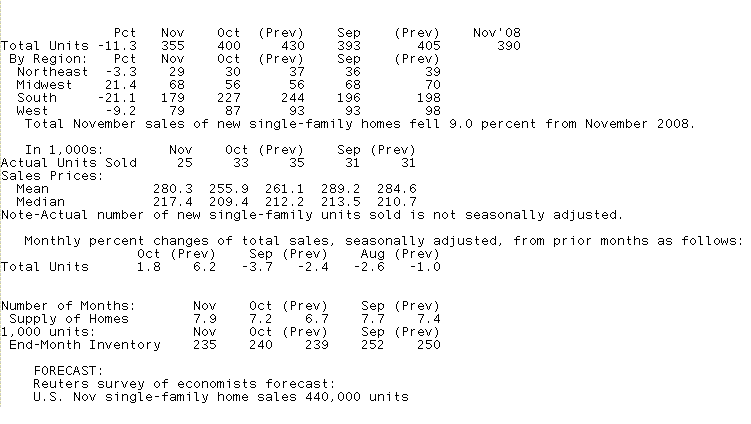
Sales of new single family homes fell 11.3% to an annual pace of 355,000 units. This was much lower than consensus estimates of 440,000 annual sales and 45,000 less than the October print of 400,000, which was REVISED FOR THE WORSE from 430,000. Another headline...this is the slowest pace of new home sales in 7 months and the worst month over month decline since January.
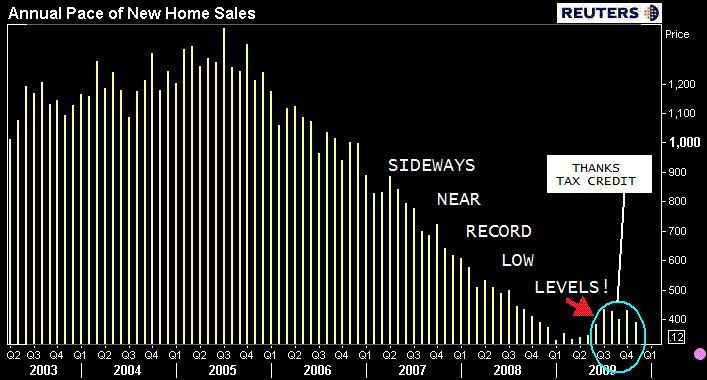
While large percentage gains and contractions have been noted in housing data lately, I think it is very important to remind that the perception of drastic improvement and dramatic contraction is more likely to occur when the market is rebounding off of record low levels of activity.
Plain and Simple: when you go from 5 to 10,m its a 100% improvement, but not all the much in the grand scheme of things. The month to month volatility we are seeing in housing data should not be a huge focus, just know activity in the housing market is moving sideways just above record low levels.
Onto the rest of the report...
It is estimated that 235,000 new homes were for sale at end of November. This is 5,000 less than the revised higher October estimate of 240,000 units and is the lowest amount of new homes for sale since April 1971 when 229,000 homes were listed for sale. This is not a big surprise. Why build new homes when no one is buying!
Spatial Learners: Check out these charts of HOUSING STARTS and BUILDING PERMITS. Notice the same "bouncing along near record lows"? Builders are wounded beasts. New Construction will not pick up until there is reason (demand) for it to pick up...hence record low "homes for sale".
At an annual pace of 355,000 sales, current new home supply will last for 7.9 months...an uptick from the October read of 7.2 months.
Home sales in the Northeast were down 3.3%, the Midwest was up +21.4%, the South down 21.1%, and the West was -9.2 %
On a positive note, the median sale price rose 3.8% to $217,400 in November. (Yay supply and demand!). On a year over year basis, the median new home price is down 1.9% when it was $221,600. The average sale price rose to $280,300 from $255,900 in October (revised lower from $261,100).
Here is a table recapping the data:
For more, THIS story on Existing Home Sales contains a BIG PICTURE discussion on the health of housing. Give it a read.


