
Two major indicators of home price trends released today showed continued appreciation although larger gains were reported by the S&P/Case-Shiller Home Price Indices than by the Federal Housing Finance Agencies Housing Price Index, both of which use the acronym HPI. The Case-Shiller HPI report covered June 2015 while FHFA released data for both June and for the second quarter of 2015.
Case Shiller's U.S. National HPI which covers all nine U.S. census divisions showed home prices gaining 4.5 percent in June 2015 compared to June 2014. This was a slightly larger year-over-year gain than reported in May when annual prices were up 4.4 percent. The 10-City Composite Index was 4.6 percent higher than a year earlier, a slightly lower increase than in May while the 20-City Composite gained 5.0 percent year-over-year, virtually the same as in the previous month.
The National Index and the 20-City Composite both rose 1.0 percent from the May level on a non-seasonally adjusted basis while the 10-City showed 0.9 percent monthly appreciation. On a seasonally adjusted bases the National Index maintained a 1.0 percent gain while the two city composites each lost 0.1 percent. All 20 cities reported increases in June before seasonal adjustment; after seasonal adjustment, nine were down, nine were up, and two were unchanged.
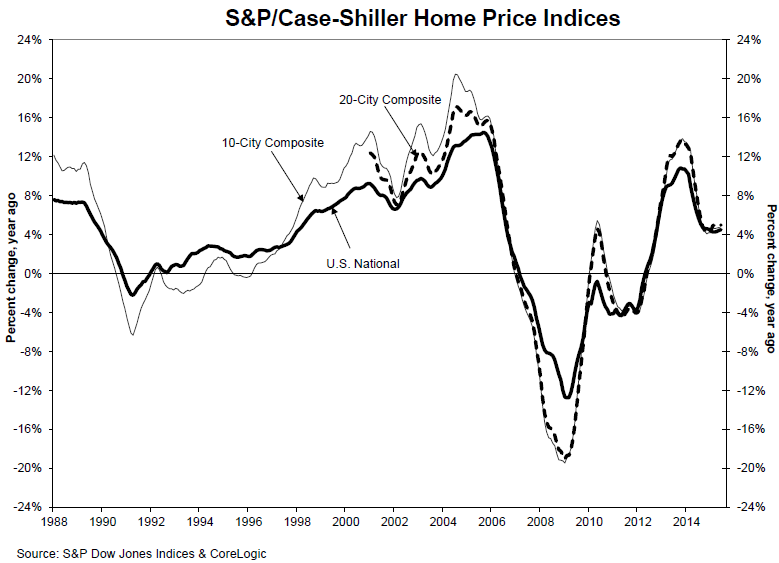
The largest annual gains were reported by Denver at 10.2 percent, the only city in double digits, followed by San Francisco and Dallas at 9.5 percent and 8.2 percent respectively. Annual appreciation was higher in June than May in 11 cities.
Phoenix and Detroit, both cities hard hit by the recession, now have the longest running streaks of annual home price appreciation; Phoenix, marked its seventh consecutive increase with a gain of 4.1 percent in June while Detroit posted a sixth increase. That 5.7 percent increase brought Detroit, the last city to remain below the January 2000=100 base for the indices back over that benchmark for the first time since the recession began.
David M. Blitzer, Managing Director and Chairman of the Index Committee at S&P Dow Jones Indices noted that the continued national increase in home prices of 4 to 5 percent is two to three times the rate of inflation. "While prices in San Francisco and Denver are rising far faster than those in Washington DC, New York, or Cleveland, the city-to-city price patterns are little changed in the last year," he said. "Washington saw the smallest year-over-year gains in five of the last six months; San Francisco and Denver ranked either first or second of all cities in the last five months. The price gains have been consistent as the unemployment rate declined with steady inflation and an unchanged Fed policy.
"The missing piece in the housing picture has been housing starts and sales. These have changed for the better in the last few months. Sales of existing homes reached 5.6 million at annual rates in July, the strongest figure since 2007. Housing starts topped 1.2 million units at annual rates with almost two-thirds of the total in single family homes. Sales of new homes are also trending higher. These data point to a stronger housing sector to support the economy. Two possible clouds on the horizon are a possible Fed rate increase and volatility in the stock market. A one quarter-point increase in the Fed funds rate won't derail housing. However, if the Fed were to quickly follow that initial move with one or two more rate increases, housing and home prices might suffer. A stock market correction is unlikely to do much damage to the housing market; a full blown bear market dropping more than 20 percent would present some difficulties for housing and for other economic sectors."
As of June average home prices for metropolitan areas within the 10- and 20-City Composites are back to winter 2005 levels. The two indices are down approximately 12 to 14 percent from the price peaks they reached in June/July 2005. Since prices hit their post-crisis low points in March 2012 the 10-City has recovered by 33.8 percent and the 20-City by 34.9 percent.
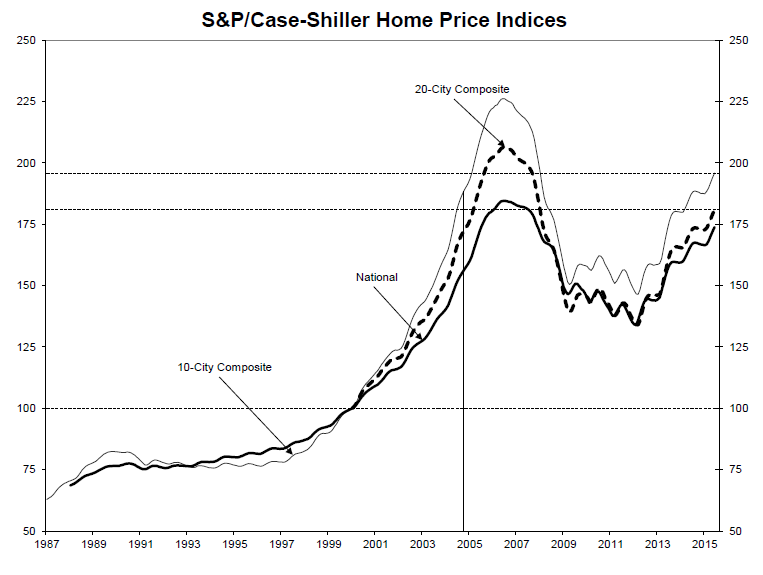
The S&P/Case-Shiller Home Price Indices are constructed to accurately track the price path of typical single-family home pairs for thousands of individual houses from the available universe of arms-length sales data. The S&P/Case-Shiller National U.S. Home Price Index tracks the value of single-family housing within the United States. The indices have a base value of 100 in January 2000; thus, for example, a current index value of 150 translates to a 50% appreciation rate since January 2000 for a typical home located within the subject market.
The 10-City Composite currently has an index level of 195.89 and the 20-City a value of 180.88. The National Index is at 173.84. Detroit is the city with the lowest index at 102.87 and Los Angeles has the highest at 237.54
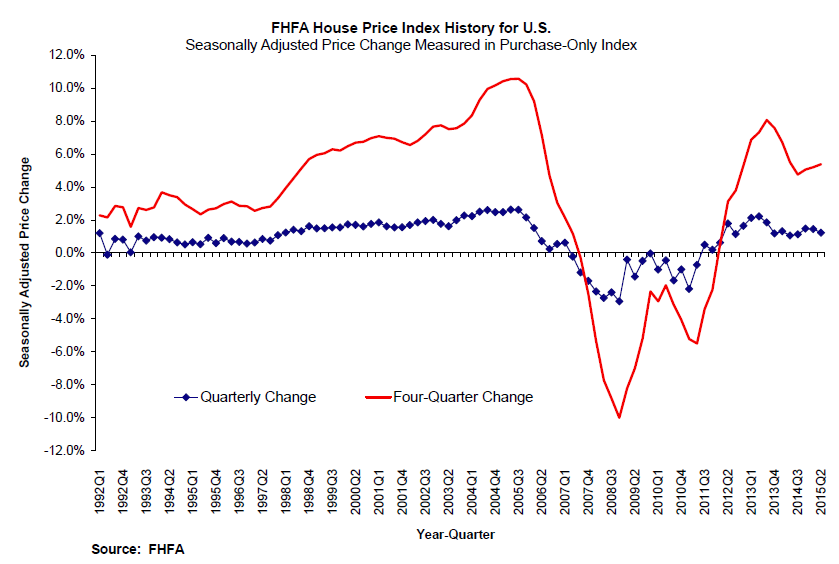
The FHFA HPI reported a month-over-month increase in home prices of 0.2 percent in June and 1.2 percent from the first to the second quarter of 2015. It was the 16th consecutive quarterly price increase for FHFA's purchase only HPI.
House prices rose 5.4 percent from the second quarter of 2014 to the same quarter this year but FHFA said the prices of other goods and services declined 1.4 percent. Thus the inflation-adjusted price of homes was up 6.9 percent over the 12 month period. FHFA calculates its HPI using home sales price information from mortgages sold to, or guaranteed by, Fannie Mae and Freddie Mac.
Home prices rose in every state between the second quarter of 2014 and the second quarter of 2015. Colorado led the states in annual appreciation with a gain of 10.6 percent followed closely by Nevada at 10.5 percent. The remainder of the top five areas were Florida (9.7 percent,) Hawaii (9.5 percent,) and Washington (8.8 percent.)
Four Quarter price appreciation leaders among the 100 most-populated metropolitan areas were San Francisco-Redwood City which saw a gain of 18.3 percent. Prices were weakest in the Allentown-Bethlehem metro area where they fell by 1.1 percent.
Of the nine census divisions, the South Atlantic division experienced the strongest increase in the second quarter, posting a 1.7 percent quarterly increase and a 6.1 percent increase since last year. House price appreciation was weakest in the Middle Atlantic division, where prices were flat in the second quarter.


