
The S&P CoreLogic Case-Shiller National Home Price Index for April set a record high, on a non-seasonally adjusted (NSA) basis for the fifth consecutive month. Some of the Case-Shiller numbers however, show some deceleration from their record pace.

The month-over-month National Index gained 0.9 percent from March on a NSA basis compared to an 0.8 percent increase in March. It was up 0.2 percent after adjustment. The annual index was up 5.5 percent. The year-over-year increase in March was 5.6 percent, and that was revised down from 5.8 percent.
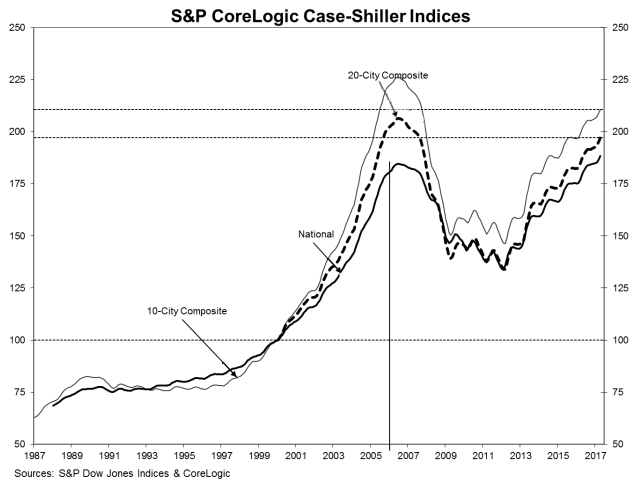
The 10-City Composite Index gained 4.9 percent compared to April 2016, down from 5.2 percent the previous month. The 20-City Composite posted a 5.7 percent year-over-year gain, down from 5.9 percent in March. The 10-City index rose 0.8 percent before adjustment and 0.2 percent after while the 20-City had increases of 0.9 percent and 0.3 percent respectively. Eighteen of 20 cities reported gains in April before seasonal adjustment; after seasonal adjustment, 13 cities saw prices rise.
Analysts who follow the 20-City Composite reached a consensus, as reported by Econoday, of 0.6 percent for the month's increase and 5.9 percent for the annual gain.
Seattle, Portland, and Dallas again reported the highest year-over-year gains among the 20 cities. Seattle led the way, up 12.9 percent, while the other two failed to break into double digits; Portland rose 9.3 percent, and Dallas was up 8.4 percent. Seven cities reported greater price increases in the year ending April 2017 versus the year ending March 2017.
"As home prices continue rising faster than inflation, two questions are being asked: why? And, could this be a bubble?" says David M. Blitzer Managing Director and Chairman of the Index Committee at S&P Dow Jones Indices. "Since demand is exceeding supply and financing is available, there is nothing right now to keep prices from going up. The increase in real, or inflation-adjusted, home prices in the last three years shows that demand is rising. At the same time, the supply of homes for sale has barely kept pace with demand and the inventory of new or existing homes for sale shrunk down to only a four- month supply. Adding to price pressures, mortgage rates remain close to 4 percent and affordability is not a significant issue.
"The question is not if home prices can climb without any limit; they can't. Rather, will home price gains gently slow or will they crash and take the economy down with them? For the moment, conditions appear favorable for avoiding a crash. Housing starts are trending higher and rising prices may encourage some homeowners to sell. Moreover, mortgage default rates are low and household debt levels are manageable. Total mortgage debt outstanding is $14.4 trillion, about $400 billion below the record set in 2008. Any increase in mortgage interest rates would dampen demand. Household finances should be able to weather a fairly large price drop."
As of April, the two composite indices have returned to winter 2007 price levels. After setting successive new price peaks the National Index is now 2.1 percent higher than it was pre-crash and has risen 40.7 percent from its 2012 trough. While the 10- and 20-City Composites are 44 percent and 47 percent above their respective troughs they remain below their summer 2006 peaks, the 10-City by 6.9 percent and the 20-City by 4.5 percent.
The S&P CoreLogic Case-Shiller Home Price Indices are constructed to accurately track the price path of typical single-family home pairs for thousands of individual houses from the available universe of arms-length sales data. The National U.S. Home Price Index tracks the value of single-family housing within the United States. The indices have a base value of 100 in January 2000; thus, for example, a current index value of 150 translates to a 50 percent appreciation rate since January 2000 for a typical home located within the subject market.
The National Index in March was at 188.50 and the 10- and 20-City Composites had readings of 210.64 and 197.19 respectively. Los Angeles has the highest index reading at 259.33 and Detroit the lowest at 112.74.


