Foreclosure activity hit the lowest level in over four years during the first quarter of 2012. Filings across the nation fell 2 percent from the fourth quarter of 2011 and were 16 percent lower than one year earlier. The overall trend during the quarter was also down as March filings were lower than those in February and the year-over-year comparison for March was also larger than for the quarter as a whole.
The figures are from the U.S. Foreclosure Market Report issued this morning by RealtyTrac, an Irvine, California firm that tracks three categories of foreclosure filings amassed from county level sources.
- Notice of Default (NOD) and Lis Pendens (LIS). This is the first legal notification from a lender that the borrower on a mortgage loan has defaulted under the terms of their mortgage and the lender intends to foreclose unless the loan is brought current.
- Auction - Notice of Trustee Sale and Notice of Foreclosure Sale (NTS and NFS): if the borrower does not catch up on their payments the lender will file a notice of sale (the lender intends to sell the property). This notice is published in local paper and contains information pertaining to the date, time and subject property address.
- Real Estate Owned or REO properties : "REO" stands for "real estate owned" and typically refers to the inventory of real estate that banks and mortgage companies have foreclosed on and subsequently purchased through the foreclosure auction if there was no offer higher than the minimum bid.
The current report covers both Quarter One and March foreclosure activity,
Filings in all categories affected 572,928 properties in the first quarter or one in every 230 U.S. housing units. This is the lowest total since the fourth quarter of 2007 when 527,740 filings were reported. There were 172,590 LIS and NOD filings, 220,265 NFS and NTS filings and 180,074 properties that became REO.
The nationwide decrease in foreclosure activity was driven by states that use the non-judicial foreclosure process. These 24 states plus the District of Columbia had an aggregate level of activity that was 8 percent lower than the 4th quarter and 28 percent lower than the first quarter one year earlier. On the other hand, the 26 states that primarily use the judicial foreclosure process saw an increase in activity of 8 percent from the fourth quarter and 10 percent from Q1 in 2011.
"The low foreclosure numbers in the first quarter are not an indication that the massive reservoir of distressed properties built up over the past few years has somehow miraculously evaporated," said Brandon Moore, chief executive officer of RealtyTrac. "There are hairline cracks in the dam, evident in the sizable foreclosure activity increases in judicial foreclosure states over the past several months, along with an increase in foreclosure starts in many judicial and non-judicial states in March. The dam may not burst in the next 30 to 45 days, but it will eventually burst, and everyone downstream should be prepared for that to happen - both in terms of new foreclosure activity and new short sale activity."
March Activity
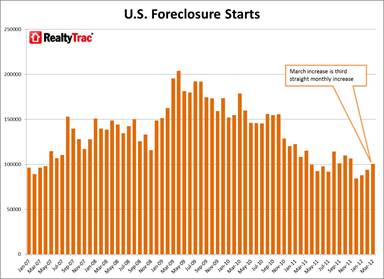
March filings also set a recent low with filings on 198,853 properties, a 4 percent decrease from February and a 17 percent decrease from one year earlier. This was the lowest monthly total since July 2007 and the first time since that date that monthly filings fell below 200,000. March decreases in default notices in foreclosure starts and bank repossessions however were largely offset by a jump in default notices, the earliest filing in the foreclosure process. These filings increased from 58,886 in February to 64,678 in March, an increase of 7 percent and the third straight monthly increase but still 11 percent below filings in March 2011.
Foreclosure starts (NTS, NFS) were down from 84,180 in February to 79,100 in March and REO filings were down to 55,075 from 63,834.
After 62 months as the top state for foreclosure activity Nevada finally slipped to second place in March, replaced by Arizona. Nevada's activity in March was down 7.78 percent from February while Arizona's filings rose 4.01 percent. The third most active state was California, down 6.82 percent; Florida which increased 1.60 percent, and Georgia where filings decreased by 8.37 on a monthly basis.
RealtyTrac also reported that the time to foreclose increased nationally during the first quarter with an average of 370 days required to finalize the action, up from 348 days in Q4 2011. This was the highest average number of days to foreclose since the first quarter of 2007. There were several key states, California, Colorado, Utah, Massachusetts, Nevada, Michigan, and Maryland, in which the timelines decreased.