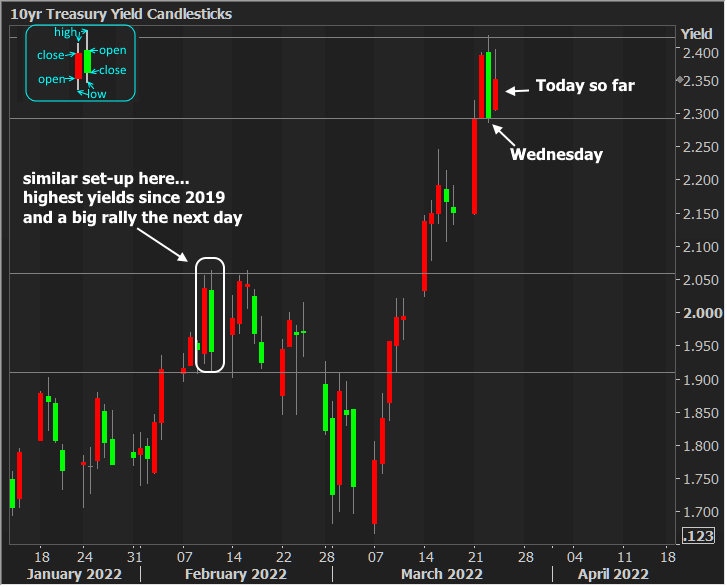
We began yesterday by counting all of the bond market head fakes seen since the Fed's first notable revision to the policy outlook in September 2021. At the time, there 7. Now there are 8. Perhaps the most notable head fake was one we didn't include in yesterday's opening chart because it was only a single day of gains (and because those gains were driven by the onset of the Ukraine situation as opposed to some significant technical dip-buying impulse). Still, it was the only example of a huge sell-off to new long term highs followed by an equally big rally the next day.
It's not really important to draw this comparison to today's market movement except inasmuch to reiterate the existence of cautionary precedents.
Overnight selling began immediately and was fairly linear throughout the night. This suggests an imbalance between Asia and the US when it comes to bond buying demand. Looking back at yesterday morning, bonds were weaker throughout the Asia-only hours and didn't rally with great purpose until the US-only hours of the afternoon.
Given the time of year and memories of 2017 and 2021 (more on that in a moment), this has traders talking once again about the role of Japan's foreign bond purchases. The chart below shows a 12 month moving average of those purchases, with fractal similarities highlighted between the two time frames in the white boxes. In both cases, investments decelerated for 6+ months from elevated levels into negative territory, bounced big, and returned to negative territory. That's as far as we've gotten in 2022, but in 2018 there was a steady expansion.

The average trader isn't considering any potential message conveyed in the chart above. Rather, it's a more simplified conclusion that Japan's fiscal year end (next week) is restraining foreign bond purchases, and that restraint could ease at the beginning of April. I'm not entirely convinced when it comes to that narrative, which is one of the reasons I offered a slightly different approach with the chart. Even then, I could poke holes in the argument made by own chart.
At best, we're left with something along the lines of the following statement: maybe the demand vs supply outlook will improve modestly and temporarily when Japan's new fiscal year begins on April 1st. Even if it does, inflation continues to set the broader tone, and it's no coincidence that we find yields under pressure as inflation expectations hit another long term high (or "all-time high" if we want to use 5yr TIPS breakevens, which didn't start trading until 2004. Had they been trading in the 80s, current levels surely would NOT be all-time highs).


