Given that yields are in an extremely low range with no past precedent, it's easy to glance at the chart, shrug one's shoulders, and conclude "oh well, just another day with the 10yr under 1.0%." In other words, when we've spent our entire lives watching yields well over 1.0%, the difference between .55% and .65% isn't as meaningful as the simple fact that both numbers are well under 1.0%.
We've been lulled into complacent Treasury rally watching, perhaps (in a good way), but silently and gradually, yields have trickled down to their 2nd lowest levels of all-time. Only March 9th (when we hit all-time lows of .32%) was any better.
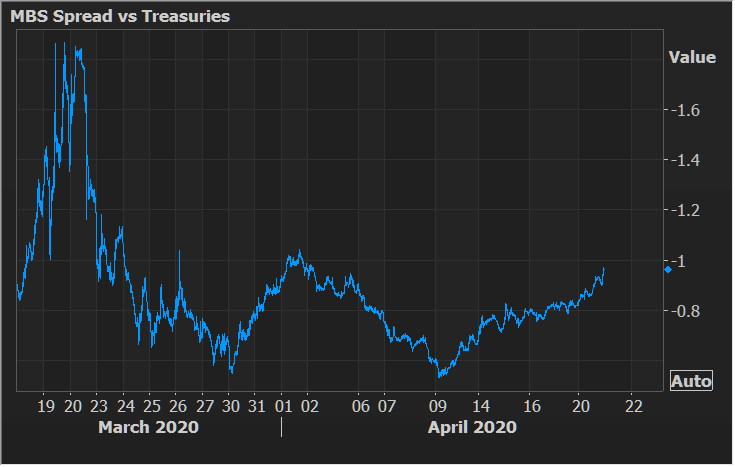
And what do we know about super low Treasury yields as it concerns MBS and the mortgage market? Let's put it this way, on March 9th, the spread between MBS yields and Treasury yields was surging to its widest levels since the financial crisis (aka MBS underperforming). Fed buying and a corrective bounce in Treasuries helped restore spread levels, but problems are popping back up now that yields are pressing lower.
Is this a big deal? Not really. Not yet anyway. As the chart below shows, spreads are merely back up to early April levels for now and not at risk of the sort of blowout seen in Mid-March. Still, every little bit of weakness stings when we're already seeing rate that are higher than MBS say they should be (due to servicing valuation drama).
Today's econ calendar is fairly calm, with Existing Home Sales being the only top tier report. News headlines are likely to be focused on oil prices with stock losses not far behind and coronavirus miscellany in a distant 3rd place. MBS are starting out roughly unchanged while Treasury yields are trading 7bps lower, under .55%. Stocks are down nearly 2% (S&P).


