We talked about momentum indicators being 'oversold' yesterday--a possible prelude to a friendly bounce in bonds. If that narrative is going to play out, it's running out of time very quickly. There was some potential for a positive outcome early in the overnight session, but as the trading day progresses, bonds are moving steadily back toward their weakest levels. Those with the strongest stomachs can still hold out hope that 10yr yields have temporarily topped out somewhere under 1.33%, but all bets are off if that ceiling breaks today (and we're only 2bps away at 9am).

If the pace of bond market weakness has caught you off guard in 2021, you're not alone. Many analysts and traders are struggling to justify current levels. In their defense, it's very easy to get caught up in a search for obvious, short-term motivations. After all, that's what's usually moving the market. Interestingly enough, the same analysts and traders (including myself in this list) wouldn't shut up about the fate of the bond market being tied to covid for most of 2020. Many of us have kept that correlation too far on the back burner so far in 2021, but it's quickly making a comeback because it's a very handy explanation for a sea-change in the bond market. Case in point: yields leaming quickly higher in 2021? And what are covid case counts doing?
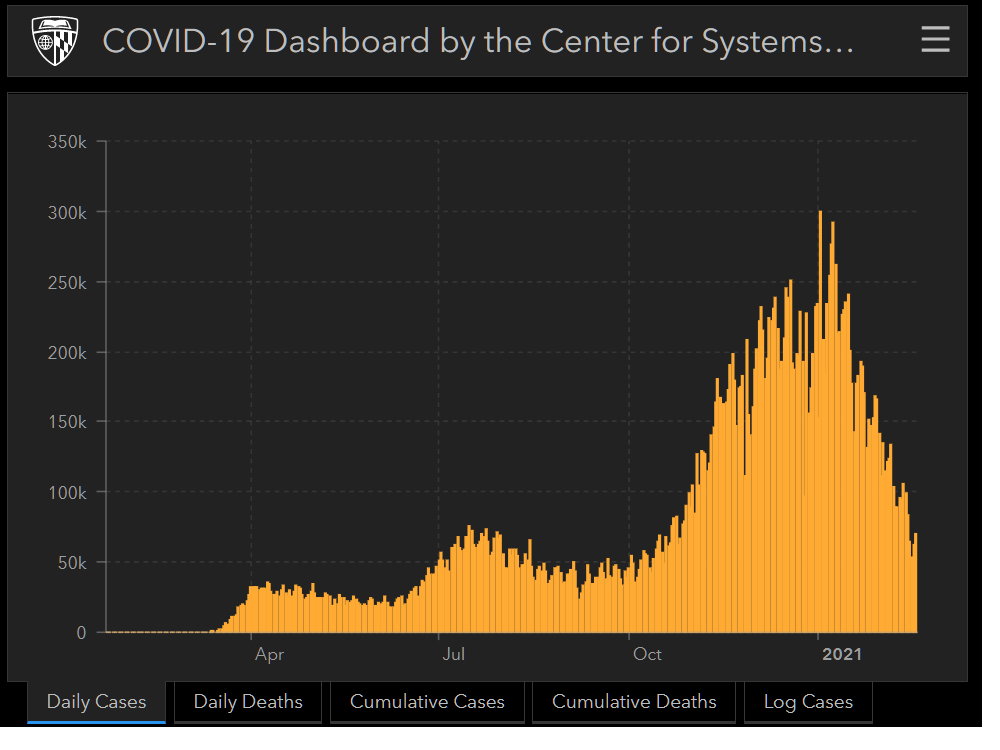
Granted, this is far from the only input for rates, but the abrupt drop in case counts so far in 2021 definitely helps explain some of the seemingly inexplicable urgency behind the selling. If that's the case, though, why are stocks selling today specifically?

Late 2018 provided a good reminder to markets about the power of rising rates to prompt stock market weakness. Big, abrupt spikes in rates make traders question gravity-defying stock prices. It's that simple. If you want to make it less simple, you could consider that the "stuff" that prompts big, abrupt spikes in rates tends to also decrease the probability of massive, ongoing fiscal and monetary support. A certain amount of both of those things is currently priced in to future trading levels. The monetary piece--especially--helps both stocks and bonds. So when traders see it as incrementally less likely, both stocks and bonds can take a hit.
Last but not least, what's up with MBS coupons? Why are some getting hit way harder than others and what should we be watching now? The short answer (if you're looking to keep an eye on negative reprice risk throughout the day) is that 2.0 coupons are the best to watch, but 2.5 coupons are very close to taking the reins at current levels. Either would work. 2.0s will be more sensitive to market movement (good option if you float with jumpy lenders).
As for why lower coupons have been hit harder recently, this is always the case in a rising rate environment. Lower coupons have higher durations because they're less likely to be refi'd. That makes them perform more like a longer-dated Treasury bond in the eyes of investors, and longer-dated bonds are getting killed recently. The following 2 charts tell the story perfectly. One shows the absolute change in price in 4 MBS coupons since the beginning of the year. The other shows the same for Treasury yields in 2, 5, 10, and 30yr maturities. The longer the duration (or the lower the MBS coupon), the bigger the sell-off has been.


