Yesterday's bond market weakness ran the risk of signalling an end to the winning streak enjoyed since January 12th. Those gains were fairly steady and they took yields from the very top of the prevailing trading pattern almost all the way to the bottom. If early trading is any consideration, today is set to confirm the negative shift.

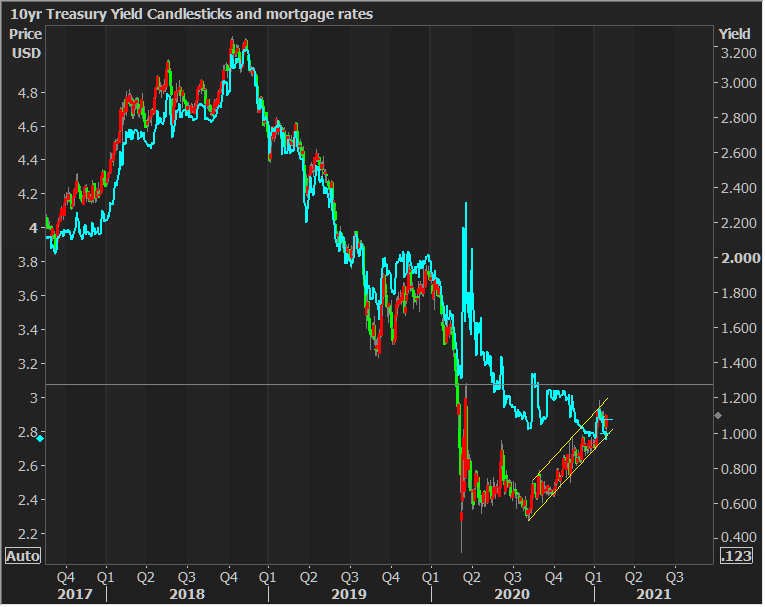
In fact, yields are already arguably halfway back across the trend channel (the parallel yellow lines that have guided the broader bond market correction since August). Here's a wider view:

Those who primarily follow the world of interest rates in terms of the mortgage market may be wondering "what correction since August?!" That's because mortgage rates cut a very different path for most of 2020. Here's the same chart with mortgage rates overlaid (teal line, left axis):

Keep in mind that this chart will look different depending on the time frame selected. For instance, if we zoom out a bit more and compress the y-axis for mortgage rates in a way that better aligns their movement with Treasuries over the years, it looks more like mortgage rates are finally meeting back up with Treasuries.
Indeed, that's the right way to view it. Why? Because there's an established range between Treasury yields and mortgage rates, and we're right back in the middle of it.

What's the implication of all this? The same thing I've been telling you for a few months now: mortgage rate invincibility has all but vanished. We'll increasingly see broader bond market volatility translate to lenders' rate sheets.
"But wait!" you may be thinking... "Mortgage rates are based on MBS, so if MBS can outperform Treasuries, rates could still be invincible!"
That's a really great point, and I think you're really smart for bringing it up. Unfortunately, most of the mortgage bond market's ability to outperform the broader bond market has been exhausted. The blue line charts the spread between MBS yields and Treasury yields. The lower it goes, the more MBS have outperformed.

True, MBS could continue tightening vs Treasuries, deeping into record territory, but the thesis here is that the lower the blue line goes, the harder it will be for it to continue to go lower. When it is done moving lower, it means MBS will be taking their lumpsbas Treasuries in the event of rising rates/yields.
"But wait!!!" you may be thinking... "mortgage rates aren't just based on MBS, but also on additional margin imposed by lenders that covers things like their profitability, the cost/value of servicing the loan, regulatory fees, special adverse market fees, and a certain premium for increased uncertainty. As that premium slowly evaporates with the defeat of the pandemic, mortgage rates could outperform MBS and thus outperform the broader bond market."
First off, wow... you're really smart about this stuff. That's another fantastic point--one I made quite a few times in 2020 before ultimately going back to the same point and using it as a warning for what we're seeing now. Several months ago, yes, lender margins all but insured mortgage rate invincibility. But now, that's less certain. We still don't know where those margins will shake out post-covid, but they've now been reluctant (the the 2 bounces) to break back across the previous record level seen in September 2012 immediately following the start of QE3 (the Fed's MBS-specific buying program).

What's the BOTTOM bottom line here? The same thing we've been discussing for a few months: it's harder and harder for mortgage rates to avoid taking part in broader bond market volatility. So when we see trends shifting as they are in Treasuries, we can be relatively assured that there's a mostly commensurate amount of paid to endure for mortgage rates.


