One of the best things to keep in mind not just for financial markets but for life in general is that explanations are rarely black and white when it comes to phenomena that aren't simple, obvious, or rooted in the laws of physics. Moreover, there are phenomena that aren't worth explaining or understanding despite the fact that human nature compels us to explain and understand just about everything. This happens quite often in financial markets. Sometimes, it happens even when the market movement makes it seem like something important is happening. Today is one of those days.
There are always a few questions you can ask yourself before listening to anything anyone else has to say. The very first thing to do is this:
BACK AWAY FROM THE CHART!
Are you freaking out (relatively) after looking at what seems to be a big move in the bond market on a 1 or 2 day chart? If so, zoom out to a 5 day chart and see if you still care. If that doesn't resolve the concern, zoom out even more. Use candlesticks. How does today look relative to other recent days? Where are we in the bigger picture trend? Could we simply be seeing some weakness after fairly pervasive strength? Are we still in the same zone of the trading range?
Let's use the current 5 day window as an example. Zooming out to 5 days would likely not give you the impression that today's weakness was completely inconsequential.

Zooming out to an even wider view, the impression may change. Yes, we still have 2 days of slightly bigger than normal weakness, but both of them have occurred in the 1.37 to 1.47 zone marketing the lower third of the recent range. Neither of them have the same look as September 23rd (lots going on there, including the global reaction to Fed's taper talk, a turn in the delta wave of covid cases, a technical break above the 1.37 line, etc).

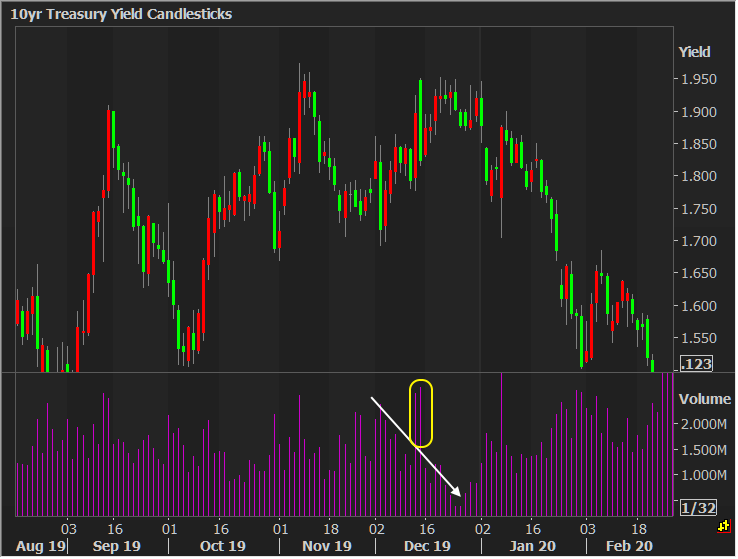
Now let's bring volume into it. For the record, I don't love using volume as an indication of significance in the bond market when it comes to daily totals. There have been sleepy days with big volume pops that mattered, but that also failed to make the daily total look significant. There have also been days with huge daily totals where nothing interesting happened and trading was flat. All that having been said, we can still glean a trend at this time of year. It's actually incredibly linear this time around, and the typical mid-month central bank breakout was smaller than normal.

What do I mean by "typical mid-month central bank breakout?" Here are the past 2 years. You'll immediately notice that 2019's breakout was much more pronounced because the bond market was more dynamic and alive as opposed to mid-pandemic when we're basically being dragged toward some inevitable showdown that can't possibly offer much by way of actionable trading ideas until we have a clearer sense of where the pandemic is heading.

All that to say, the second thing to do after "backing away from the chart," is:
CONSIDER THE TIME OF YEAR.
Any time between the 2nd half of November and the 2nd week of January, you really have to take any intraday moves with a grain of salt, even if they seem significant at the time. Lighter liquidity and volume makes it easier for any given market mover to move markets.
Last but not least, maybe things are actually in the process of moving enough that we should care! At some point we have to concede such things, but it's really a judgment call based on technical levels, available headlines/newswires, intraday volume surges, and related market activity (i.e. is some other market moving in an obvious, correlated way with bonds?).
As far as today is concerned, the AM weakness could be as simple as a concession for today's 20yr auction--a concession that is bigger than it otherwise might be due to the time of year and recent technical bounce at 1.35%. We'll know more about that just after 1pm today.


