MBS and Treasuries do such a good job traveling together that it's especially notable when they diverge. That's doubly true on days like today where MBS have been "green" at times this morning (i.e. in positive territory) while Treasuries have been red. While this may be obvious, curious, or perhaps even interesting, it's arguably not entirely significant.
There's always some ebb and flow between MBS and Treasuries. It's just usually harder to notice because it tends to happen when both sides of the market are moving in the same direction. In other words, if MBS are red, but Treasuries are "more red," MBS are still outperforming. As we discussed yesterday, the current stint of outperformance has several potential motivations:
- Treasuries are coping with supply this week with another round of auctions and another pick-up in corporate bond issuance (which indirectly impacts TSYs more than MBS. Here's why).
- MBS supply has dropped back down into the $5bln / day range after averaging $6.1 bln last week
- A steeper yield curve (in moderation) favors MBS vs 10yr yields as the average mortgage doesn't tend to last 10 years (and "steeper" means that longer term rates are rising more than shorter term rates).
- Last but not least, there are simply ebbs and flows in the relative value of MBS as far as investors are concerned
Let's dig into that last bullet point for just a moment. In plainer terms, this refers to MBS looking like "a good deal" relative to Treasuries--often due to MBS underperforming enough to great an attractive buying opportunity. Remember, there are some big investors out there who decide to buy (and sell) MBS as an investment based on its spread to Treasuries. If they perceive that MBS spreads have widened by enough to suggest a correction (i.e. MBS underperformed enough to increase the odds of a bounce), they may decide to buy. If their pockets are deep enough or if their decision is well-timed enough, the short-term trend in MBS vs Treasuries would then shift back in favor of MBS.
This notion of "buying the dip" in MBS prices relative to Treasuries is definitely in play as MBS spreads have been widening (aka underperforming or cheapening) consistently since the beginning of July. The following chart shows the spread between MBS yields and the blended 5/10yr Treasury yield (a 5/10 blend is more relevant to MBS than a pure 10yr yield for a few reasons).
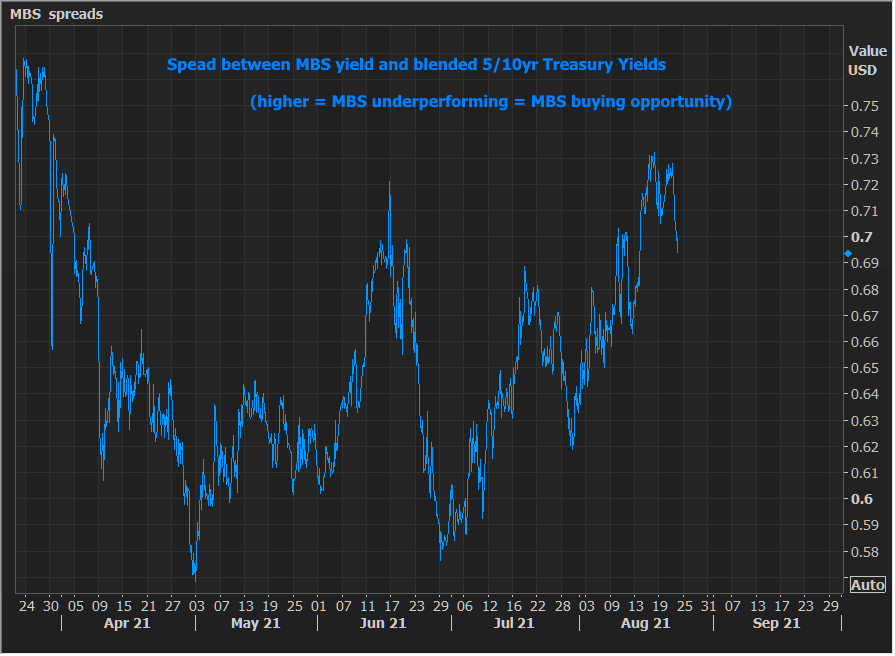
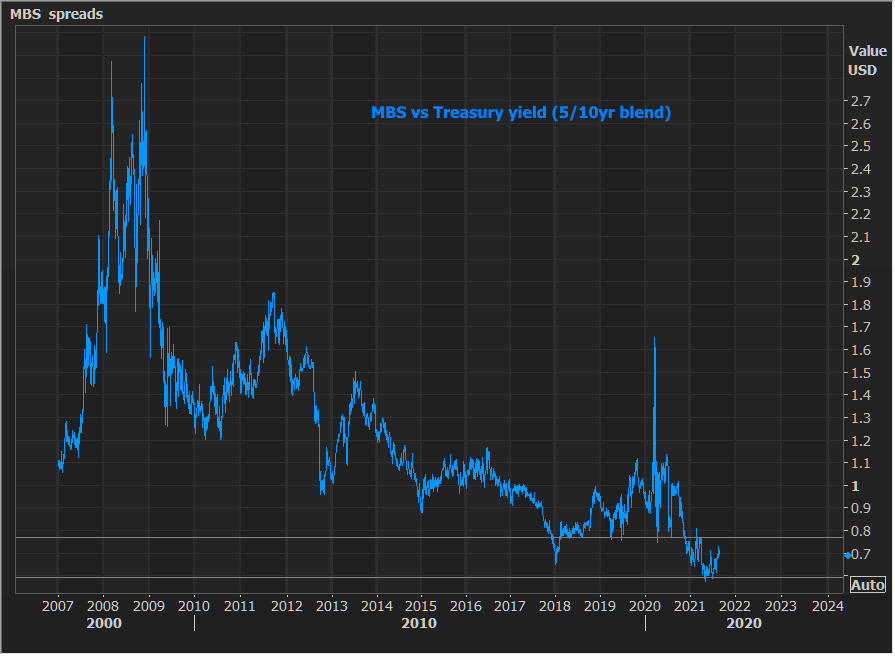
Note the uptrend (aka underperformance) since July and the past 2 days of support (i.e. the blue line is moving lower so far this week... MBS outperforming). For those who aren't quite sure about this 5/10 blend business, rest assured, it doesn't look too terribly different than the chart would look if we only used 10yr yields:

The last consideration has to do with context. While these fluctuations may look dramatic when we're zoomed in to a time frame of only a few months, it's good to remember that all of this drama is playing out in a historically narrow, low range. In fact, apart from a brief dip at the beginning of 2018, the 2021 is the first time MBS spreads have sustainably been under 75bps vs the 5/10yr blend. It'll be "news" when and if they break and hold above that ceiling.