
Although home prices were generally expected to begin cooling off by the middle of 2017, the most recent Case-Shiller Home Price Index suggests the strong performance doesn't show signs of stopping. A 5.8 percent year-over-year increase in June just sent the National Home Price Index to another all-time high. The index, which covers all nine U.S. census divisions, established a new peak for the seventh consecutive month. The June increase was 0.1 percentage point higher than the annual gain in May. Before seasonal adjustment the index rose 0.9 percent compared to May and after adjustment it was up 0.4 percent.
The 10-City Composite Index was up 4.9 percent year-over-year, a slight downtick from its 5.0 percent gain a month earlier, while the 20-City Composite posted the same 5.7 percent annual increase as in May. Both composites were up 0.7 percent from the previous month before seasonal adjustment. Afterward the 10-City was unchanged and the 20-City saw increase by 0.1 percent. All 20 cities reported higher prices in June before seasonal adjustment; after seasonal adjustment, 14 cities saw prices rise.
Analysts were polled by Econoday for their projections for the 20-City Composite. They predicted a monthly increase ranging from 0.0 percent to 0.8 percent with a consensus of 0.3 percent seasonally adjusted. The consensus was for an annual increase of 5.8 percent.
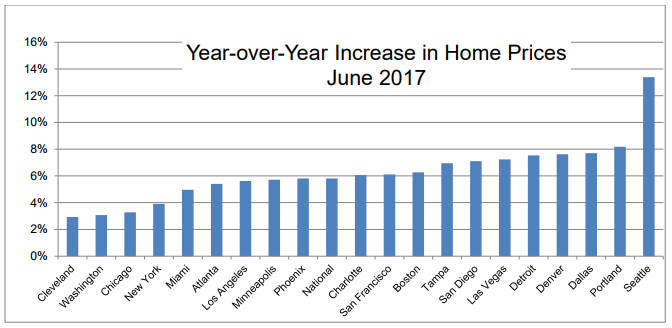
Price gains in Seattle continue unabated; up 13.4 percent from June 2016. Trailing at a distance are Portland, up 8.2 percent and Dallas at 7.7 percent. Nine cities reported greater price increases in the year ending June 2017 versus the year ending May 2017. It is also notable that Detroit surrendered last place among the list of cities tracked, a spot it has occupied for at least a decade. Its index number, 116.37 is now slightly higher than that of Cleveland.
The chart below compares the year-over-year returns across the twenty cities that make up the larger composite index. As noted, prices in Seattle prices are rising 5.2 percentage points faster than second-place Portland. Seattle has seen the highest year over-year percentage gains for the last ten months.
"The trend of increasing home prices is continuing," says David M. Blitzer, Managing Director and Chairman of the Index Committee at S&P Dow Jones Indices. "Price increases are supported by a tight housing market. Both the number of homes for sale and the number of days a house is on the market have declined for four to five years. Currently the months-supply of existing homes for sale is low, at 4.2 months. In addition, housing starts remain below their pre-financial crisis peak as new home sales have not recovered as fast as existing home sales."
"Rising prices are the principal factor driving affordability down. However, other drivers of affordability are more favorable: the national unemployment rate is down, and the number of jobs created continues to grow at a robust pace, rising to close to 200,000 per month. Wages and salaries are increasing, maintaining a growth rate a bit ahead of inflation. Mortgage rates, up slightly since the end of 2016, are under 4 percent. Given current economic conditions and the tight housing market, an immediate reversal in home price trends appears unlikely."
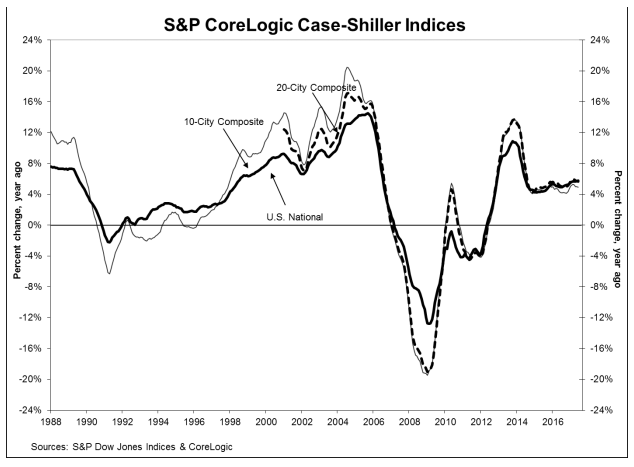
The Case-Shiller National Index is now 4.3 percent above its June 2006 peak and has risen 43.7 percent from its February 2012 trough. Both composites are still below their peaks, the 20-City by 2.9 percent and the 10-City by 5.5 percent.
The S&P CoreLogic Case-Shiller Home Price Indices are constructed to accurately track the price path of typical single-family home pairs for thousands of individual houses from the available universe of arms-length sales data. The National U.S. Home Price Index tracks the value of single-family housing within the United States. The indices have a base value of 100 in January 2000; thus, for example, a current index value of 150 translates to a 50 percent appreciation rate since January 2000 for a typical home located within the subject market.
The National Index has a new high of 192.60, up from last month's peak high of 190.61. The 10- and 20-City Composites had readings of 213.86 and 200.54 respectively. Los Angeles had the highest index reading at 263.57 and Cleveland the lowest at 115.37.


