
The S&P CoreLogic Case-Shiller U.S. National Home Price NSA Index put on a repeat performance for May. The index, which covers all nine U.S. census divisions, was up 6.4 percent, the same annual increase as was reported in April. There was a slight escalation in the monthly numbers, which estimated an increase of 1.1 percent before seasonal adjustment, and 0.4 percent afterward. In April the index rose 1.0 percent and 0.3 percent respectively.
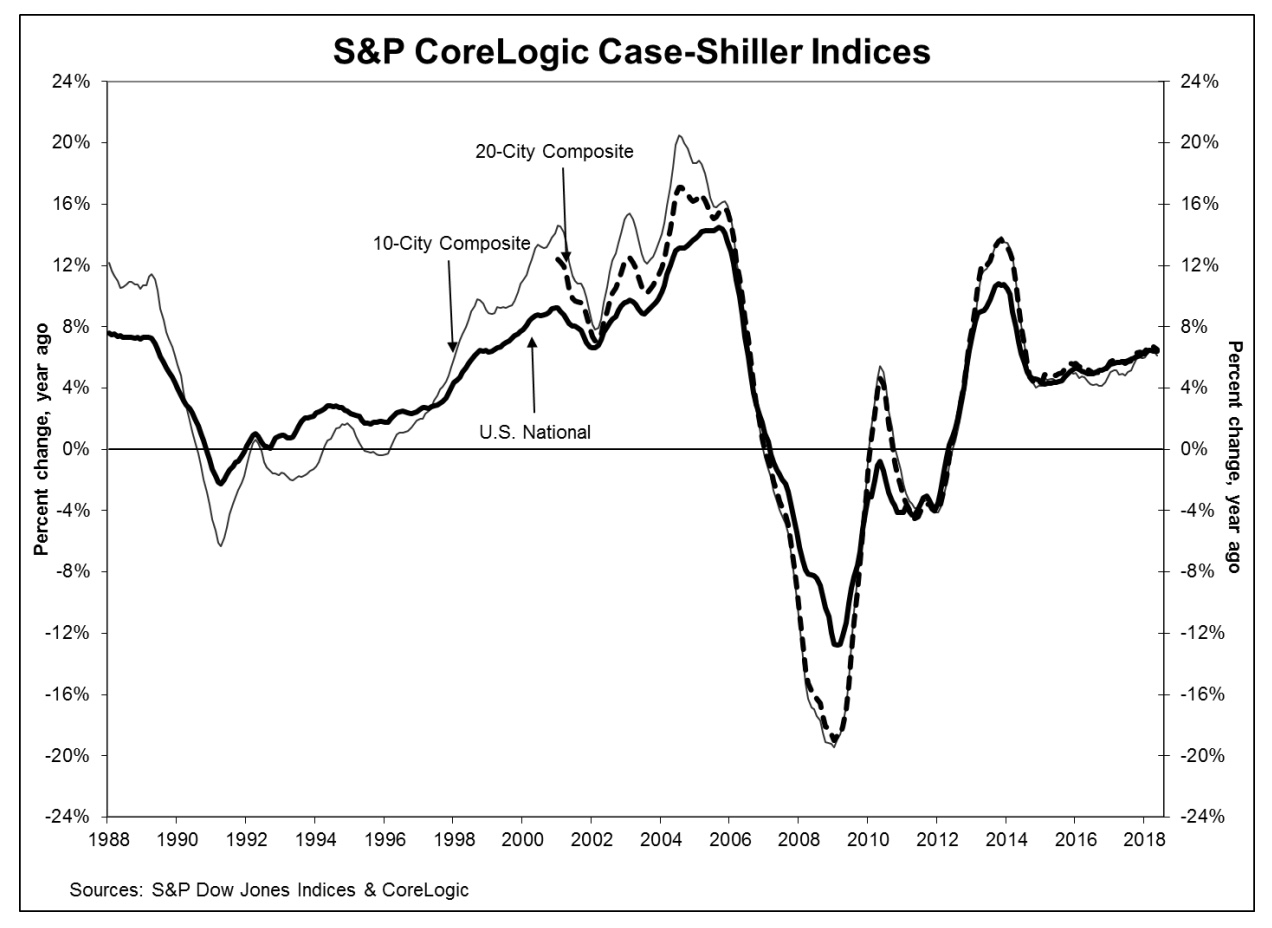
The two composite indices did decelerate slightly from their April pace. The10-City Composite gained 6.1 percent on an annual basis, down from 6.4 percent the previous month and the 20-City Composite's appreciation slowed from 6.7 percent to 6.5 percent year-over-year. On a month-over-month basis the 10-City was up 0.5 percent before adjustment and 0.1 percent after and the 20-City had respective gains of 0.7 percent and 0.2 percent. Nineteen of 20 cities reported monthly increases in May before seasonal adjustment, while 16 of 20 cities reported increases after seasonal adjustment.
Analysts polled by Econoday provide forecasts for the 20-City Composite and were looking for slightly higher gains. They expected an annual increase of 6.6 percent and monthly appreciation of 0.8 percent without adjustment and 0.3 percent with it.
Seattle, Las Vegas, and San Francisco continued to report the highest year-over-year gains among the 20 cities. Seattle was again in first place with a 13.6 percent annual increase followed by Las Vegas, up 12.6 percent, and San Francisco with 10.9 percent appreciation. Seven of the 20 cities reported greater gains during the year ending May 2018 than they had for the year ending April 2018.
"Home prices continue to rack up gains two to three times greater than the inflation rate," says David M. Blitzer, Managing Director & Chairman of the Index Committee at S&P Dow Jones Indices. "The year-over-year increases in the S&P CoreLogic Case-Shiller National Index have topped 5 percent every month since August 2016. Unlike the boom-bust period surrounding the financial crisis, price gains are consistent across the 20 cities tracked in the release; currently, the range of the largest to smallest price change is 10 percentage points compared to a 20-percentage point range since 2001, and a 25-percentage point range between 2006 and 2009. Not only are prices rising consistently, they are doing so across the country.
"Continuing price increases appear to be affecting other housing statistics. Sales of existing single-family homes - the market covered by the S&P CoreLogic Case-Shiller Indices - peaked last November and have declined for three months in a row. The number of pending home sales is drifting lower as is the number of existing homes for sale. Sales of new homes are also down and housing starts are flattening. Affordability - a measure based on income, mortgage rates and home prices - has gotten consistently worse over the last 18 months. All these indicators suggest that the combination of rising home prices and rising mortgage rates are beginning to affect the housing market."
According to the Case-Shiller indices, average home prices for those areas covered by the two composites are back to their winter 2007 levels. The National Index however continues to establish new highs. It has now surpassed its July 2006 peak by 9.9 percent and has risen 51.5 percent since hitting a Great Recession trough in February 2012. The 20-City Composite is also up from its previous 2006 peak by 2.6 percent while the 10-City has almost completely recovered from the housing crisis and now lags its peak by only 0.4 percent.
The S&P CoreLogic Case-Shiller Home Price Indices are constructed to accurately track the price path of typical single-family home pairs for thousands of individual houses from the available universe of arms-length sales data. The National U.S. Home Price Index tracks the value of single-family housing within the United States. The indices have a base value of 100 in January 2000; thus, for example, a current index value of 150 translates to a 50 percent appreciation rate since January 2000 for a typical home located within the subject market.
The National Index set another new record high in May of 202.95, up from the previous month's peak of 200.86. The 10- and 20-City Composites had readings of 225.31 and 211.94 respectively. Los Angeles claims the highest index reading at 281.70. Cleveland had the lowest reading at 120.74.


