
In its "first look" at May mortgage data published last month Black Knight Financial Services noted that the prepayment rate for mortgages, historically a good indicator of refinance activity, rose by 3.31 percent from April to 1.30 percent. However, the company also noted that prepayment rates continue to trail 2015 levels (down by 2.40 percent from May 2015) despite interest rates being lower than last year.
In this month's Mortgage Monitor Black Knight takes a deeper look at these prepayment rates (CPR) and finds that Ginnie Mae, which buys or guarantees government-backed mortgages (FHA, VA, etc.) have outpaced all other investor categories for 19 of the last 24 months. During the past 12 months, overall prepayments on Ginnie Mae loans have been roughly 13 percent higher than the rest of the market
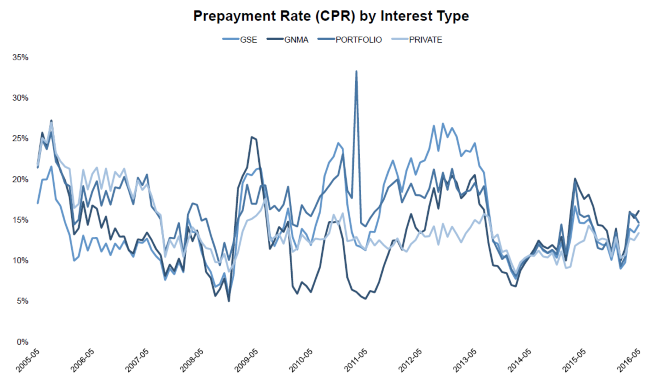
Black Knight says this is particularly interesting since the borrowers supported by Ginnie Mae tend to have lower credit scores than those whose loans are purchased or guaranteed by the GSEs (Fannie Mae or Freddie Mac) or are kept in bank portfolios. Prepayment speeds have been significantly lower for lower scored borrowers over the last six years. More interesting still is that loans to those in the lowest credit band (below 680) have had prepayment speeds 26 percent higher than the rest of the market over the last 12 months.
Black Knight says one explanation may be that increasing equity is allowing these borrowers to refinance without mortgage insurance and thus lower payments and another that streamline FHA products make it easier for FHA borrowers to refinance. The greatest driver however seems to be the loans' vintage. There is an outsized share of Ginnie Mae loans originated from 2009 to 2011. These loans have the highest CPR rates overall at present.
Another change is the percentage of borrowers who refinance from one Ginnie Mae loan into another. From 2009 to 2012 that was the path of over 80 percent of refinancing borrowers, but since 2013 over 50 percent of refinancing of Ginnie Mae loans has been into GSE or portfolio products, the largest share since the start of the housing crisis.

Black Knight ties this shift to the 2013 FHA requirements that borrowers with initial loan-to-value (LTV) ratios of 90 percent or higher pay mortgage insurance premiums for the life of the loan. Those with LTV ratios of less than 90 percent must pay premiums for 11 years.
Another pattern evident in the prepay speeds is the continued refinancing of adjustable rate mortgages (ARMs) into other products. Although prepayment rates are down by 2 percent from a year earlier the decline is 4 percent for fixed rate products while prepayments on ARMs are up 8 percent. This is not a new phenomenon. The rates of ARM prepays have been rising on an annual basis for the last 18 months while they have been declining for fixed rate loans for the past 7 months. Nearly two thirds of ARMs are being traded in for fixed rate products even if it means accepting a higher interest rate than the existing loan.

The share of ARMs originated overall has also declined with interest rates, falling from 7 percent of all originations last November to about 4 percent in April, the lowest share in nearly three years. Jumbo ARM originations have also fallen, from a 29 percent share in November to 25 percent in April. In early 2014 the jumbo arm share was over 40 percent. Larger loans in the non-jumbo market are more likely to be ARMs than smaller loans as well.

The subprime ARM market is close to disappearing. Fewer than 2 percent of recent sub-700 credit score loans in recent months have been ARMs, the lowest share since 2009.
Black Knight also looked mortgage lending to borrowers who carry student debt and found that it has increased in recent years, hitting a new high in 2014, the last full year for which data is available. In that year at least 19 percent of originations went to borrowers with such debt.
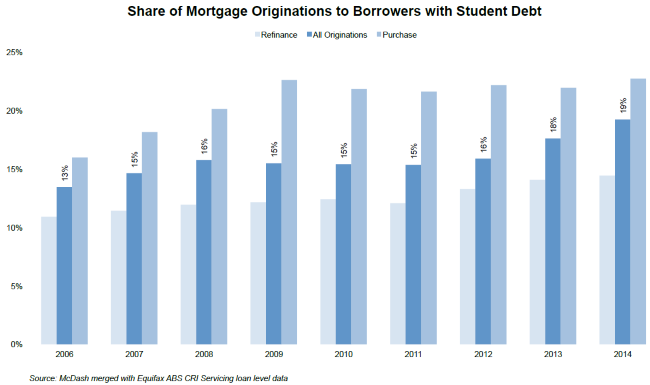
Purchase originations are more likely to have a student debt component than refinancing; 23 percent to 14 percent. The purchasing share has remained relatively flat as refinancing has risen and Black Knight notes that the rise in the overall share of student-debt related originations is because of a shift from a refinance to a purchase heavy market from 2012 to 2014. This, the company says, is something to watch if and when interest rates start to rise again.
Looking at the universe of mortgages the company finds the share of those held by borrowers with student loan debt has increased from 5.4 million in 2006 to 7.7 million today, a 40 percent change. Those mortgages now represent 15 percent of all active loans.
Borrowers with mortgages tend to perform better on their student loan debt than those without mortgages; fewer than 1 percent are 90 or more days past due on their student loans. However, those borrowers with mortgages who are severely delinquent on their student loans are five times more likely to be delinquent on their mortgages than those with current student loan debt and six times more likely than those without student debt at all.
Only 38 percent of non-student loan indebted borrowers have credit scores below 720 compared to 52 percent of those with student debt. Less than 10 percent of very high credit scores (over 760) belong to student loan debtors and they are unlikely to be delinquent those loans but when they are it is a very strong indicator of mortgage risk. They are 16 times more likely to be non-current on their mortgage than high score borrowers without student debt.
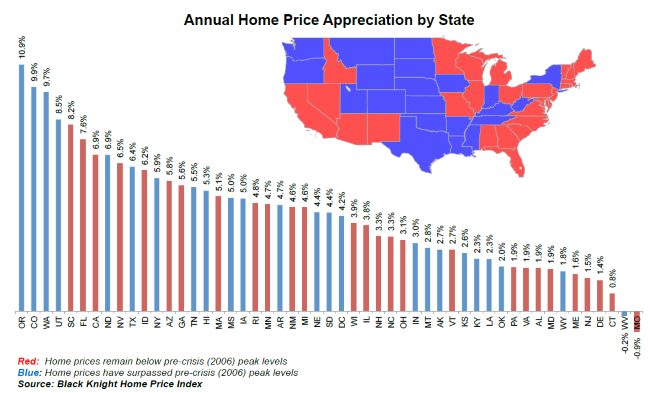
Finally, Black Knight updated its home price and negative equity reports to reflect first quarter 2016 activity. Home prices have now seen 48 consecutive months of a home appreciation and nationally prices are within 2.9 percent of the June 2006 peak. Twenty-three states have now surpassed their own pre-crisis peaks.
A 2 percent appreciation in Quarter 1 helped 425,000 borrowers regain positive equity. The national negative equity rate is now 5.6 percent, down 13 percent from a year earlier with 2.8 million homeowners underwater. At the end of 2010 negative equity peaked at nearly 29 percent.
The highest negative equity rate is in Nevada at 12 percent with Missouri and Rhode Island following at 11 percent. At the other end of the spectrum less than 1 percent of homes in Colorado and Texas lack equity.
Rising home values pushed the level of tappable equity up by $260 billion in the first quarter, a six percent increase from Q4 2015. At $4.4 trillion tappable equity is within 10 percent of its 2005 peak. There are now 38 million homeowners with at least 20 percent equity in their homes with an average of $116,000.
Homeowners however are not rushing to tap that equity. There were just over 300,000 cash-out refinances in the first quarter and those refis extracted $20 billion. This is roughly ½ of one percent of the available equity and while it is $5 billion or 32 percent more than was pulled out in the first quarter of 2015, it is down from the $20.5 billion cashed out in the fourth quarter of 2015. However, a continued rise in HELOC originations may indicate that is the route homeowners are taking to tap equity while retaining their current low-interest rate first mortgages.


