
The U.S. Census Bureau and the Department of Housing and Urban Development have released New Residential Construction statistics for February 2011.
Housing
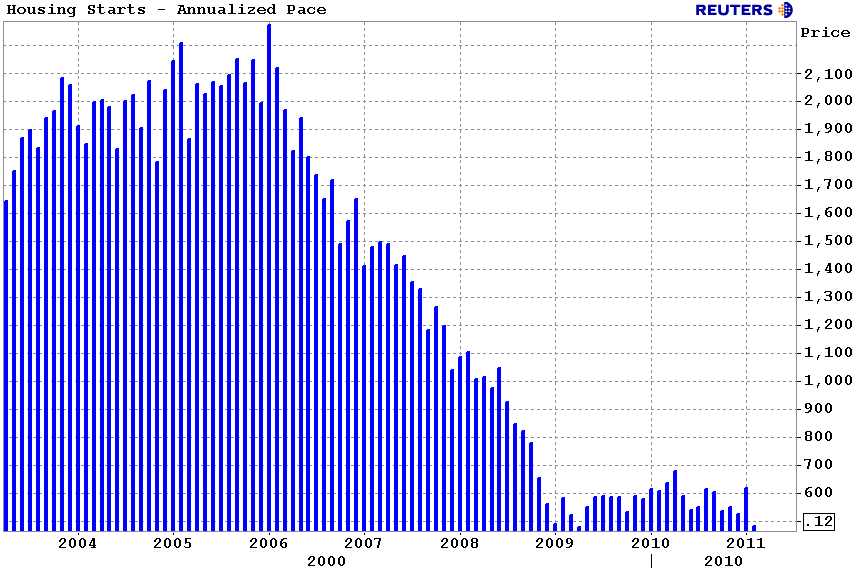
Starts data estimates how much new residential real estate construction
occurred in the previous month. New construction means digging has
begun. Adding rooms or renovating old ones does not count, the builder
must be constructing a new home (can be on old foundation if
re-building). Although the report offers up single family housing, 2-4
unit housing, and 5-unit and above housing data, single family housing
is by far the most important as it accounts for 70-80% of total home
building (which might be shifting more toward multi-family in the years
ahead).
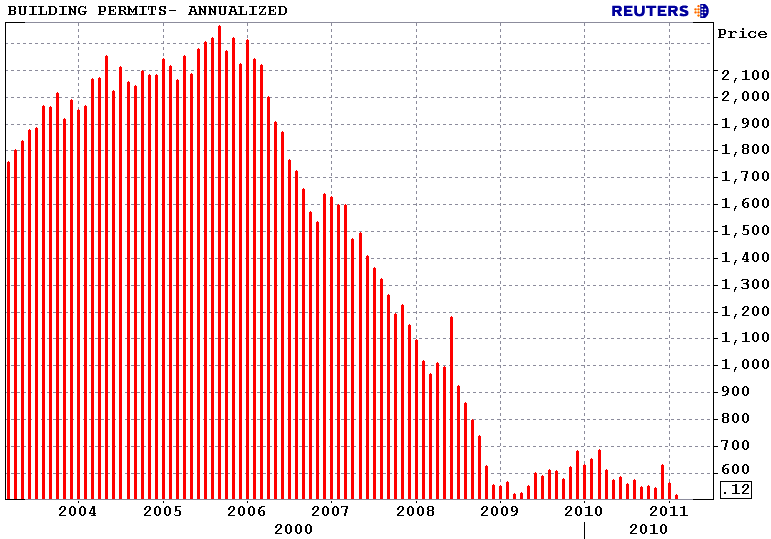
Building Permits data provides an estimate on the number
of homes planning on being built. This indicator basically tracks how
much future construction activity we should expect to take place in the
future. This data is a part of Conference Board's Index of Leading
Economic Indicators.
Here is quick recap from Reuters....
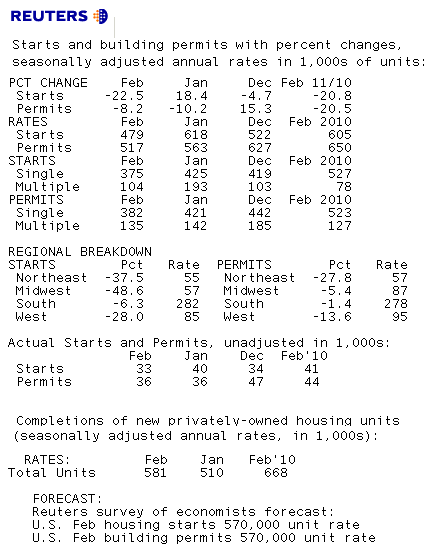
RTRS -US FEB HOUSING STARTS -22.5 PCT VS JAN +18.4 PCT (PREV +14.6 PCT)
RTRS -US FEB HOUSING STARTS 479,000 UNIT RATE (CONSENSUS 570,000) VS JAN 618,000 (PREV 596,000)
RTRS -US FEB HOUSING PERMITS -8.2 PCT VS JAN -10.2 PCT (PREV -10.2 PCT)
RTRS -US FEB HOUSING COMPLETIONS +13.9 PCT TO 581,000 UNIT RATE VS JAN 510,000
RTRS -TABLE-U.S. Feb housing starts fell 22.5 pct
Excerpts from the Release...
BUILDING PERMITS
Privately-owned housing units authorized by building permits in February were at a seasonally adjusted annual rate of 517,000. This is 8.2 percent (±3.3%) below the revised January rate of 563,000 and is 20.5 percent (±3.5%) below the February 2010 estimate of 650,000.
Single-family authorizations in February were at a rate of 382,000; this is 9.3 percent (±1.2%) below the revised January figure of 421,000. Authorizations of units in buildings with five units or more were at a rate of 121,000 in February.
HOUSING STARTS
Privately-owned housing starts in February were at a seasonally adjusted annual rate of 479,000. This is 22.5 percent (±9.8%) below the revised January estimate of 618,000 and is 20.8 percent (±9.0%) below the February 2010 rate of 605,000.
Single-family housing starts in February were at a rate of 375,000; this is 11.8 percent (±10.0%) below the revised January figure of 425,000. The February rate for units in buildings with five units or more was 96,000.
HOUSING COMPLETIONS
Privately-owned housing completions in February were at a seasonally adjusted annual rate of 581,000. This is 13.9 percent (±16.8%)*above the revised January estimate of 510,000, but is 13.0 percent (±14.9%)* below the February 2010 rate of 668,000.
Single-family housing completions in February were at a rate of 468,000; this is 11.2 percent (±15.6%)* above the revised January rate of 421,000. The February rate for units in buildings with five units or more was 107,000.
----------------------
RTRS -US FEB BUILDING PERMITS RECORD LOW 517,000 UNIT RATE
RTRS -US FEB HOUSING STARTS DECLINE LARGEST SINCE MARCH 1984 (-26.4 PCT);
Plain and Simple: What's New?
I know of at least one strong housing market: WASHINGTON D.C. This market has been active. Besides Case-Shiller home price data backing that up, I see it and hear about it on a daily basis. This is my hometown. My mother is an appraiser. My father is an originator. READ MORE
Do you know of another healthy housing market?
Looking ahead...
The New Home Sales survey is primarily based on a sample of houses selected from building permits. That means we can look to Building Permits data for an indication of New Home Sales to come. Yikes. It doesn't look good for New Home Sales....


