
The Census Bureau and Department of Housing and Urban Development have released New Residential Sales data for December 2010.
New Residential Sales data provides statistics on the sales of new privately-owned single-family residential structures in the United States. Data included in the press release are (1) the number of new single-family houses sold; (2) the number of new single-family houses for sale; and (3) the median and average sales prices of new homes sold.
A house is considered sold when either a sales contract has been signed or a deposit accepted. Included in our estimates are houses for which a sales contract is signed or deposit accepted before construction has actually started; for instance, houses sold from a model or from plans before any work has started on the footings or foundations. These estimates also include houses sold while under construction or after completion. This survey does not follow through to the completion ("closing") of the sales transaction, so even if the transaction is not finalized, the house is still considered sold. Preliminary new home sales figures are subject to revision due to the survey methodology and definitions used. The survey is primarily based on a sample of houses selected from building permits.
New residential sales estimates only include new single-family residential structures. Sales of multi-family units are excluded from these statistics.
Here is a Quick Recap from Reuters...
RTRS-US DEC SINGLE-FAMILY HOME SALES 329,000 UNIT ANN. RATE (CONS 300,000) VS NOV 280,000 (PREV 290,000)
RTRS-US DEC SINGLE-FAMILY HOME SALES +17.5 PCT VS NOV UNCHANGED (PREV +5.5 PCT)
RTRS-US DEC HOME SALES NORTHEAST -5.0 PCT, MIDWEST +3.2 PCT, SOUTH +1.8 PCT, WEST +71.9 PCT
RTRS-US DEC NEW HOME SUPPLY 6.9 MONTHS' WORTH AT CURRENT PACE VS NOV 8.4 MONTHS
RTRS-US DEC MEDIAN SALE PRICE $241,500, +8.5 PCT FROM DEC 2009 ($222,600)
RTRS-US HOMES FOR SALE AT END OF DEC 190,000 UNITS VS NOV 195,000 UNITS
RTRS-US 2010 SINGLE-FAMILY HOME SALES -14.4 PCT TO RECORD LOW 321,000 UNITS VS 2009 375,000 UNITS
Excerpts from the Release...
Sales of new single-family houses in December 2010 were at a seasonally adjusted annual rate of 329,000. This is 17.5 percent (±17.7%) above the revised November rate of 280,000, but is 7.6 percent (±17.0%) below the December 2009 estimate of 356,000.
The median sales price of new houses sold in December 2010 was $241,500; the average sales price was $291,400. The seasonally adjusted estimate of new houses for sale at the end of December was 190,000. This represents a supply of 6.9 months at the current sales rate.
----------------
The month over month gains look large relative to recent months. This is a positive from a "here and now" perspective.
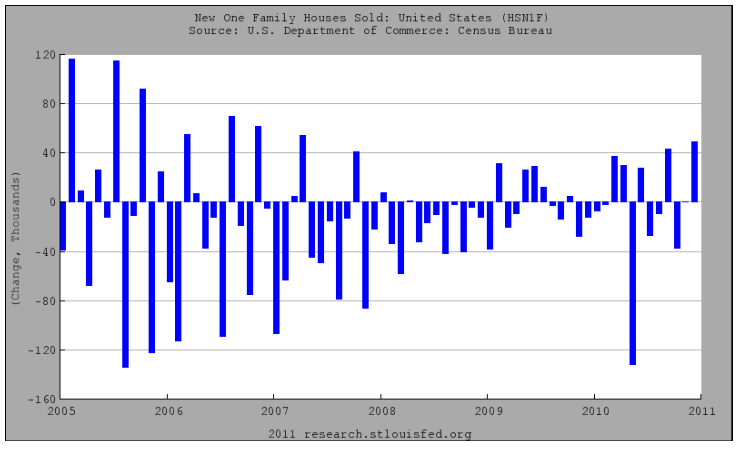
But when we zoom out and see the big picture, New Home Sales continue to bounce around record lows.

It is important to note the large "standard error" in this sample survey data. I highlighted that metric in the data above. "This is 17.5 percent (±17.7%) above the revised November rate of 280,000, but is 7.6 percent (±17.0%) below the December 2009 estimate of 356,000."
Quick background: When reporting this data, statisticians at the Census Bureau are making an ESTIMATE on the number of New Home Sales in December based on a sampling of a larger pool of data. These estimates are not perfect by any means, especially when the new construction sample size is small like it is right now in the new construction market.
MORE EXPLANATORY NOTES FROM THE CENSUS BUREAU....
These statistics are estimated from sample surveys. They are subject to sampling variability as well as nonsampling error including bias and variance from response, nonreporting, and undercoverage. Estimated average relative standard errors of the preliminary data are shown in the tables.Whenever a statement such as “2.5 percent (±3.2%) above” appears in the text, this indicates the range (-0.7 to +5.7 percent) in which the actual percent change is likely to have occurred. All ranges given for percent changes are 90-percent confidence intervals and account only for sampling variability. If a range does not contain zero, the change is statistically significant. If it does contain zero, the change is not statistically significant; that is, it is uncertain whether there was an increase or decrease. The same policies apply to the confidence intervals for percent changes shown in the tables.
------------------------------------
What does this mean about the December New Home Sales data?
Based on a smaller sample size, with 90% certainty, the Census Bureau's survey indicates the month over month change in New Home Sales was in a range of -0.2% to +35.2%. That is a wide range! The Census Bureau isn't even certain if New Home Sales increased or decreased in December. That means we should view this report as "statistically insignificant".
FURTHERMORE!
The New Home Sales survey is primarily based on a sample of houses selected from building permits. So we should look at Building Permits data in December for more insight on the noise in this data.
Here is an excerpt: "Single-family authorizations in December were at a rate of 440,000; this is 5.5 percent (±2.3%) above the revised November figure of 417,000."
Wait wait wait......forgot to mention the asterisk placed on building permits data by the Commerce Department: "Increases in the numbers of housing units authorized by building permits in the Northeast and West in December 2010 may be related to changes to state building codes for new residential construction effective in January 2011 in California, Pennsylvania, and New York."
Plain and Simple: We don't know if New Home Sales increased or decreased in December. The standard error is too large. There is much distortion in all facets of this survey data. This tends to happen when the pool from which the survey sample is taken has shrunk to a record low. This is exactly why we need to see a four month trend develop before we make any assumptions about an upticks in New Home Sales. I guess that debunks the 72% jump seen in the West.....


