NFP has come and gone, let's see where things stand....
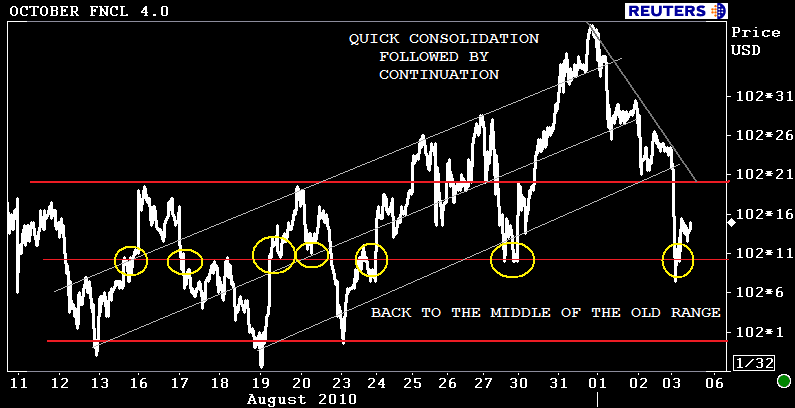
The October delivery FNCL 4.0 is -0-09 at 102-15. In the chart below I called attention to a few technical inflection points. The ascending trend channel that helped mortgage rates hit new lows on Wednesday has broken down and FNCL 4.0s have made their way back into the range that moderated price action for the majority of August. The falling knife found support and bounced higher directly in the middle of that range.
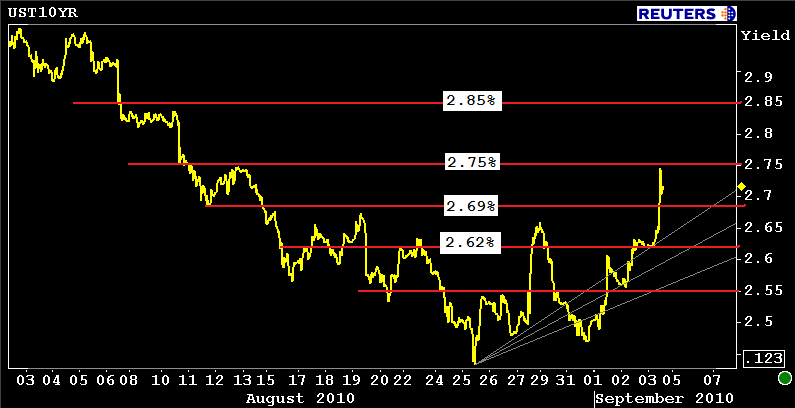
10s flagged lower for the entire month of August (all summer really) and are now flagging higher. The 2.625% coupon bearing 10 year TSY note is off its session price lows (98-24) at 99-07 yielding 2.715% (+8.8bps). 10s are the worst spot on the curve followed by 7s (+8.6bps) and the long bond (+7.6bps). Volume was heavy into the sell off but the longs have not totally lost their grip yet, although it's weakening on a daily basis. The 2s/10s curve is 7bps steeper at 219bps. Swaps spreads are tighter as vol deflates.
If the pain trade persists, I see 10s testing 2.85%....which is highly likely given the extremely slow econ calendar in the week ahead and pending Treasury issuance in the long end of the curve. Overseas buyers must show up to those auctions or weakness will intensify....
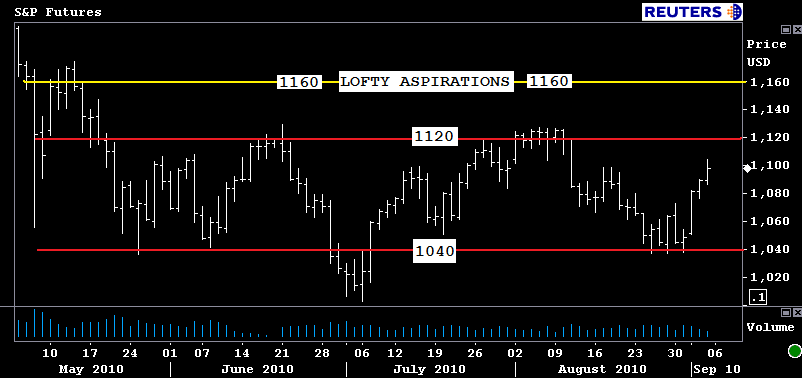
Short covering and new position adding combined to lead S&Ps up to 1,100 after NFP, a key psychological pivot point. In the chart below you can see why I keep saying stocks were stagnant all summer, the S&P has traded back and forth between 1040 and 1120 since May. Boring! With the econ calendar essentially empty and fund managers chasing alpha (returns), I expect flows to favor buyers in the short term and the S&P to test 1120 again (1107 and 1115 will be firm resistance on the way up). If that level is broken, equity traders will be hesitant to add more long positions until 1130 is surpassed.
S&P futures are currently +10 at 1099.50
Plain and Simple: All signs point toward higher rates in the week ahead.


