
Both the S&P CoreLogic Case-Shiller indices and the House Price Index (HPI) provided by the Federal Housing Finance Agency (FHFA) showed slight acceleration in home price increases during October. Case Shiller's National Home Price Index, which covers all nine U.S. census divisions, reported an annual gain of 3.3 percent compared to a 3.2 percent rate of appreciation in September. On a monthly basis the National Index was up 0.1 percent on an unadjusted basis, and it gained 0.5 percent after seasonal adjustment.
The 10-City Composite Index posted annual growth of 1.7 percent in October, 0.2 percentage point more than the rate in September. The 20-City Composite was up 2.2 percent year-over-year compared to 2.1 percent the prior month.
Like the National Index, both city composites rose 0.1 percent on a non-adjusted basis from September. They were both 0.4 percent higher after adjustment. Eight of the 20 cities reported increases before seasonal adjustment while 18 cities did so afterward.
The Sunbelt continues to lead the way in price gains. Phoenix was again in first place with a 5.8 percent annual increase, followed by Tampa, up 4.9 percent and Charlotte, with prices rising 4.8 percent. Twelve of the 20 cities reported greater price increases in the year ending October 2019 versus the year ending September 2019
"October's U.S. housing data continue to be reassuring," says Craig J. Lazzara, Managing Director and Global Head of Index Investment Strategy at S&P Dow Jones Indices. "With October's 3.3 percent increase in the national composite index, home prices are currently more than 15 percent above the pre-financial crisis peak reached July 2006. October's results were broad-based, as both our 10- and 20-city composites rose. Of the 20 cities in the composite, only San Francisco saw a year-over-year price decline in October.
"At a regional level, Phoenix retains the top spot for the fifth consecutive month with October's 5.8 percent year-over-year gain. The Southeast region was also strong, as Tampa, Charlotte, and Atlanta all rose by more than 4.0 percent.
"As was the case last month, after a long period of decelerating price increases, the national, 10-city, and 20-city composites all rose at a modestly faster rate in October compared to September. This stability was broad-based, reflecting data in 12 of 20 cities. It is, of course, still too soon to say whether this marks an end to the deceleration or is merely a pause in the longer-term trend."
The chart below depicts the annual returns of the U.S. National, 10-City Composite, and 20-City Composite Home Price Indices.
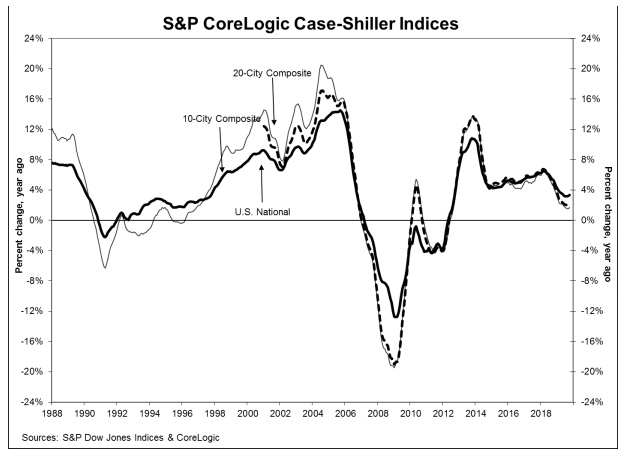
As Lazzara noted, the National Index is now 15.1 percent higher than its previous 2006 peak. The 20-City Composite is 5.8 percent higher than its pre-recession level and the 10-City is up 2.2 percent.
The S&P CoreLogic Case-Shiller Home Price Indices are constructed to accurately track the price path of typical single-family home pairs for thousands of individual houses from the available universe of arms-length sales data. The National U.S. Home Price Index tracks the value of single-family housing within the United States. The indices have a base value of 100 in January 2000; thus, for example, a current index value of 150 translates to a 50 percent appreciation rate since January 2000 for a typical home located within the subject market.
As of October 2019, the National Index was at 212.43 up from 212.20 in September. The 10- and 20-City Composites had readings of 231.16 and 218.43 respectively, compared to 230.89 and 218.27 the prior month. Los Angeles has the highest index at 288.35 and Cleveland the lowest at 127.80.
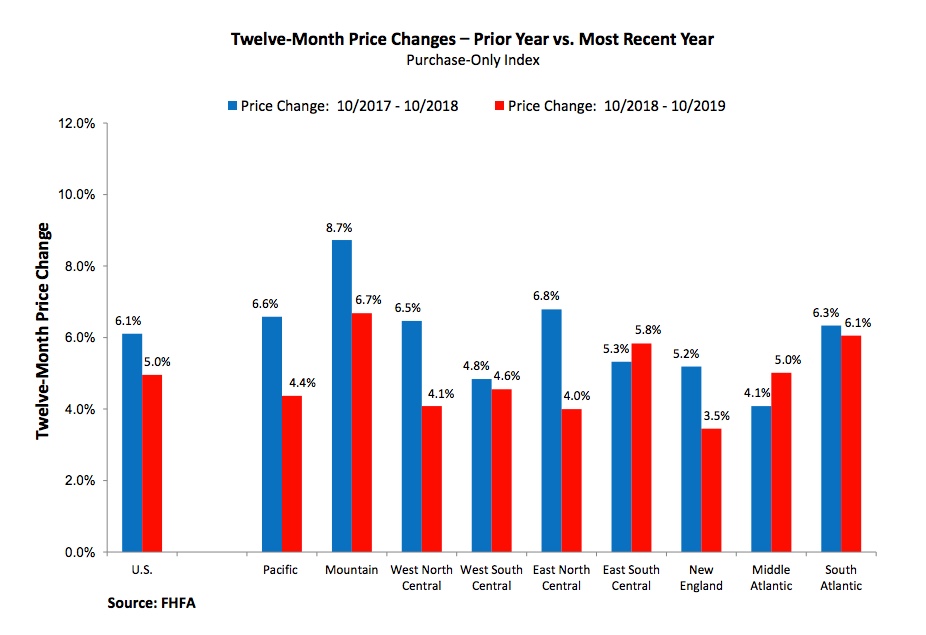
FHFA reported the home prices as tracked by its HPI rose 0.2 percent from September to October and were 5.0 percent higher on an annual basis. The 0.6 percent monthly increase initially reported for September was revised up to 0.7 percent in the current report.
The seasonally adjusted monthly changes in the nine census divisions ranged from an 0.5 percent decline in the East North Central Division (Michigan, Wisconsin, Illinois, Indiana, Ohio) to an 0.7 percent gain in both the West South Central (Oklahoma, Arkansas, Texas, Louisiana) and East South Central (Kentucky, Tennessee, Mississippi, Alabama) Divisions. All nine divisions posted annual increases ranging from 3.5 percent in New England to 6.7 percent in the Mountain Division (Montana, Idaho, Wyoming, Nevada, Utah, Colorado, Arizona, New Mexico.)
FHFA bases its HPI on home prices of purchase mortgages acquired by the GSEs Fannie Mae and Freddie Mac. The index was benchmarked at 100 in January 1991 and had a level in October of 280.2


