
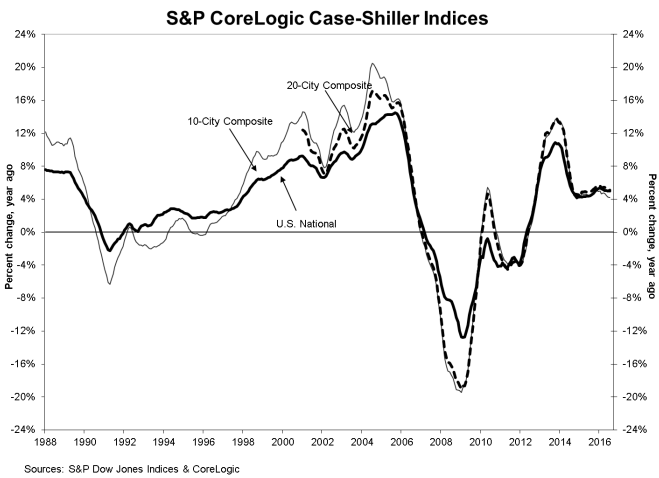
While the annual gains in its nationwide index accelerated slightly in July the S&P CoreLogic Case-Shiller 10- and 20-City Composite Indices showed a slight slowing on an annual basis. The U.S. National Home Price Index, covering all nine U.S. census divisions showed prices rising 5.1% over the 12 months ending in July compared to a June to June gain of 5.0 percent. On a month-over-month basis the National Index was up 0.7 percent (compared to 0.1 percent in June) on a non-seasonally adjusted basis and 0.4 percent when adjusted.
The 10-City Composite Index slowed from a 4.3 percent appreciation in June to 4.2 percent in July and the 20-City slipped by 0.1 point to 5.0 percent. Portland, Seattle, and Denver led in gains among the 20 cities for the sixth consecutive month with Portland posting a 12.4 percent increase followed by Seattle at 11.2 percent, and Denver with at 9.4 percent. Nine cities reported greater price increases in the year ending July 2016 than they did for the year ending in June.
Monthly increases for the 10-City Composite were a 0.5 percent unadjusted gain and a loss of 0.1 percent when seasonally adjusted. The monthly unadjusted number for the 20-City was +0.6 percent while the seasonally adjusted number was unchanged. After seasonal adjustment, 12 cities saw prices rise, two cities were unchanged, and six cities experienced negative monthly prices changes.
David M. Blitzer, Managing Director and Chairman of the Index Committee at S&P Dow Jones Indices said, "Both the housing sector and the economy continue to expand with home prices continuing to rise at about a 5 percent annual rate," says. "The statement issued last week by the Fed after its policy meeting confirms the central bank's view that the economy will see further gains. Most analysts now expect the Fed to raise interest rates in December. After such Fed action, mortgage rates would still be at historically low levels and would not be a major negative for house prices,
"The S&P CoreLogic Case-Shiller National Index is within 0.6 percent of the record high set in July 2006. Seven of the 20 cities have already set new record highs. The 10-year, 20-year, and National indices have been rising at about 5 percent per year over the last 24 months. Eight of the cities are seeing prices up 6 percent or more in the last year. Given that the overall inflation is a bit below 2 percent, the pace is probably not sustainable over the long term. The run-up to the financial crisis was marked with both rising home prices and rapid growth in mortgage debt. Currently, outstanding mortgage debt on one-to-four family homes is 12.6 percent below the peak seen in the first quarter of 2008 and up less than 2 percent in the last four quarters. There is no reason to fear that another massive collapse is around the corner."
Cities in the 10- and 20-City indices are now back to their winter 2007 levels. The National Index is 0.6 percent below its peak in July 2006 and has rising 37.0 percent off the bottom reached in February 2012. The 10-City is 7.6 percent and the 20-City 9.4 percent below their 2006 peaks.
The S&P CoreLogic Case-Shiller Home Price Indices are constructed to accurately track the price path of typical single-family home pairs for thousands of individual houses from the available universe of arms-length sales data. The National U.S. Home Price Index tracks the value of single-family housing within the United States. The indices have a base value of 100 in January 2000; thus, for example, a current index value of 150 translates to a 50 percent appreciation rate since January 2000 for a typical home located within the subject market.
The National Index in July was at 183.57 and the 10- and 20-City Composites had readings of 204.92 and 190.91 respectively. Los Angeles has the highest index reading at 251.17 and Detroit the lowest at 108.81.


