
Standard and Poor's has released February Case-Shiller Home Price data...
S&P/Case-Shiller provides two monthly indices which track the price path of single family homes in a 10-City and a 20-City data base. Each index combines matched price pairs from sales of individual homes. All indices are based on a value of 100 which represents home prices in January 2000. A current index value of 150 percent would translate to a 50 percent appreciation in price since that date. S&P/Case-Shiller provides its data in both seasonally adjusted (SA) and non-seasonally adjusted form but recommends relying on the latter.
Quick Recap from Reuters....
20 CITY INDEX
RTRS - US FEB 20-METRO AREA HOME PRICES -1.1 PCT (CONSENSUS -1.0) VS JAN -1.1 PCT
RTRS - US FEB 20-METRO AREA HOME PRICES -3.3 PCT (CONSENSUS -3.3 PCT) FROM YEAR AGO
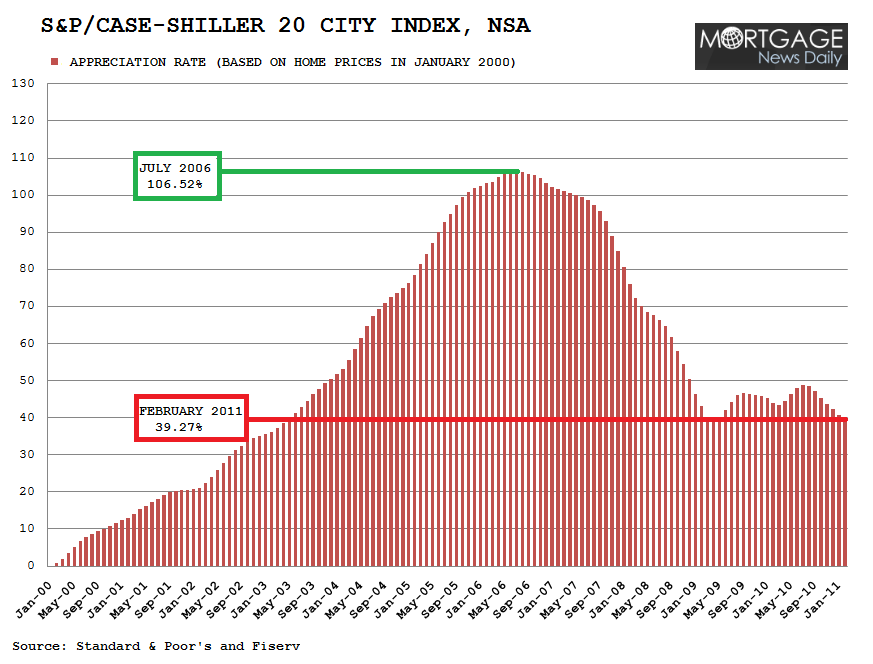
The following graph does not illustrate the actual 20 city index supplied by S&P. Instead we have presented the data in appreciation rate format. In the chart below the current 20 city index value of 139.27 would translate to a 39.27 percent appreciation in price since January 2000. The 20 City Composite is virtually back to its April 2009 trough value (139.26) and is 67.25 percentage points below its fastest apprecation rate (July 2006).
10 CITY INDEX....
RTRS - US HOME PRICES IN 10 METRO AREAS -1.1 PCT IN FEBRUARY VS REVISED -1.0 PCT IN JAN - S&P/CASE-SHILLER
RTRS - US FEB HOME PRICES IN 10 METROPOLITAN AREAS -2.6 PCT FROM YEAR AGO - S&P/CASE-SHILLER
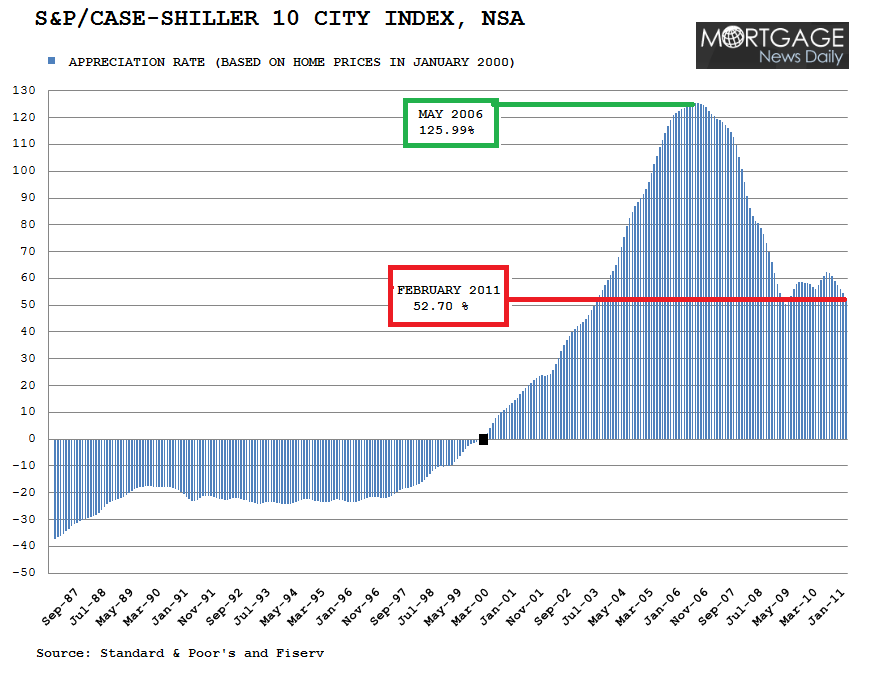
The following graph does not illustrate the actual 10 city index composite supplied by S&P. Instead we have presented the data in appreciation rate format. In the chart below the 10 city index of 152.70 would translate to a 52.70 percent appreciation in price since January 2000. The 10 city composite is almost back to its low of 150.44 seen in April 2009 and is 73.29 percentage points below its fastest appreciation rate (May 2006).
Excerpts from the Release....
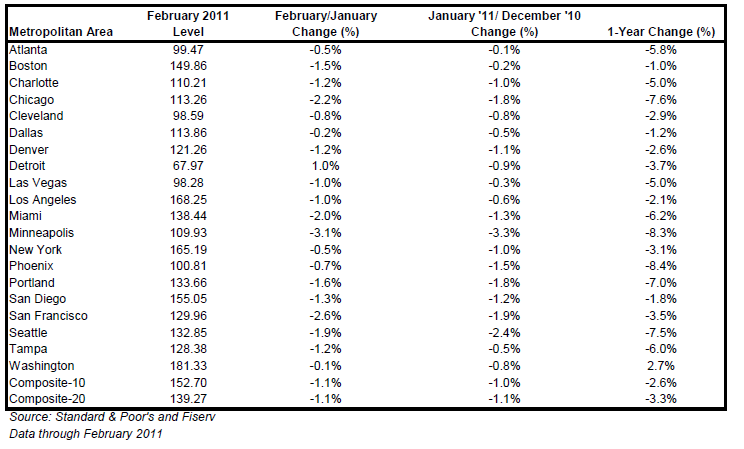
- Nineteen of the 20 MSAs and both the 10-City and 20-City Composite fell in February versus January. Of these, 14 MSAs and both Composites posted negative monthly returns for more than six consecutive months.
- Ten of the 11 cities that made new lows in January 2011 saw new lows again in February 2011 for the third consecutive month in February 2011: Atlanta, Charlotte, Chicago, Las Vegas, Miami, New York, Phoenix, Portland (OR), Seattle and Tampa.
- Detroit avoided another new low, managing a +1.0% increase in February over January, the only city with a positive monthly change.
- Washington D.C. was the only market to post a year-over-year gain with an annual growth rate of +2.7%.
“There is very little, if any, good news about housing. Prices continue to weaken, trends in sales and construction are disappointing.” says David M. Blitzer, Chairman of the Index Committee at S&P Indices.
"Ten of the 11 MSAs that recorded index lows in January fell further in February. The one exception, Detroit, is 30% below its 2000 price level. The 20-City Composite is within a hair’s breadth of a double dip. Fourteen MSAs and both Composites have continued to decline month-over-month for more than six consecutive months as of February.
“Atlanta, Cleveland and Las Vegas join Detroit as cities with home prices below their 2000 levels; and Phoenix is barely above its January 2000 level after a new index low. The one positive is Washington D.C. with a positive annual growth rate, +2.7%, and home prices more than 80% over its January 2000 level. Other cities holding on to large gains from 11 years ago include Los Angeles (68.25%), New York (65.19%) and San Diego (55.05%)”
“Recent data on existing-home sales, housing starts, foreclosure activity and employment confirm that we are still in a slow recovery. Existing home sales and housing starts rose in March, but remain close to recent lows. Foreclosure activity showed decreases in mortgage delinquencies in the fourth quarter of 2010, but are still close to historic highs. The nation and 34 states registered a decline in their unemployment rates for March.”
Plain and Simple: According to Case-Shiller data, home prices have fallen every month since July 2010. That's a seven month losing streak. READ MORE: Home Prices Stuck in Negative Feedback Loop. Would You Buy?


