
It should hardly come as a surprise, each month the report from the S&P CoreLogic Case Shiller home price report starts the same way, "home prices continued their rise across the country over the last 12 months." There is also a note that the National Index has established another all-time high. It is no different for today's report covering the January data.
The National Home Price Index, indicating prices across all nine census divisions, came in with a year-over-year gain of 6.2 percent, ticking down from the 12-month increase of 6.3 percent in December. Both before and after seasonal adjustment, the monthly change was 0.5 percent, in December the non-adjusted increase was 0.2 percent and the seasonally adjusted change was 0.7 percent.
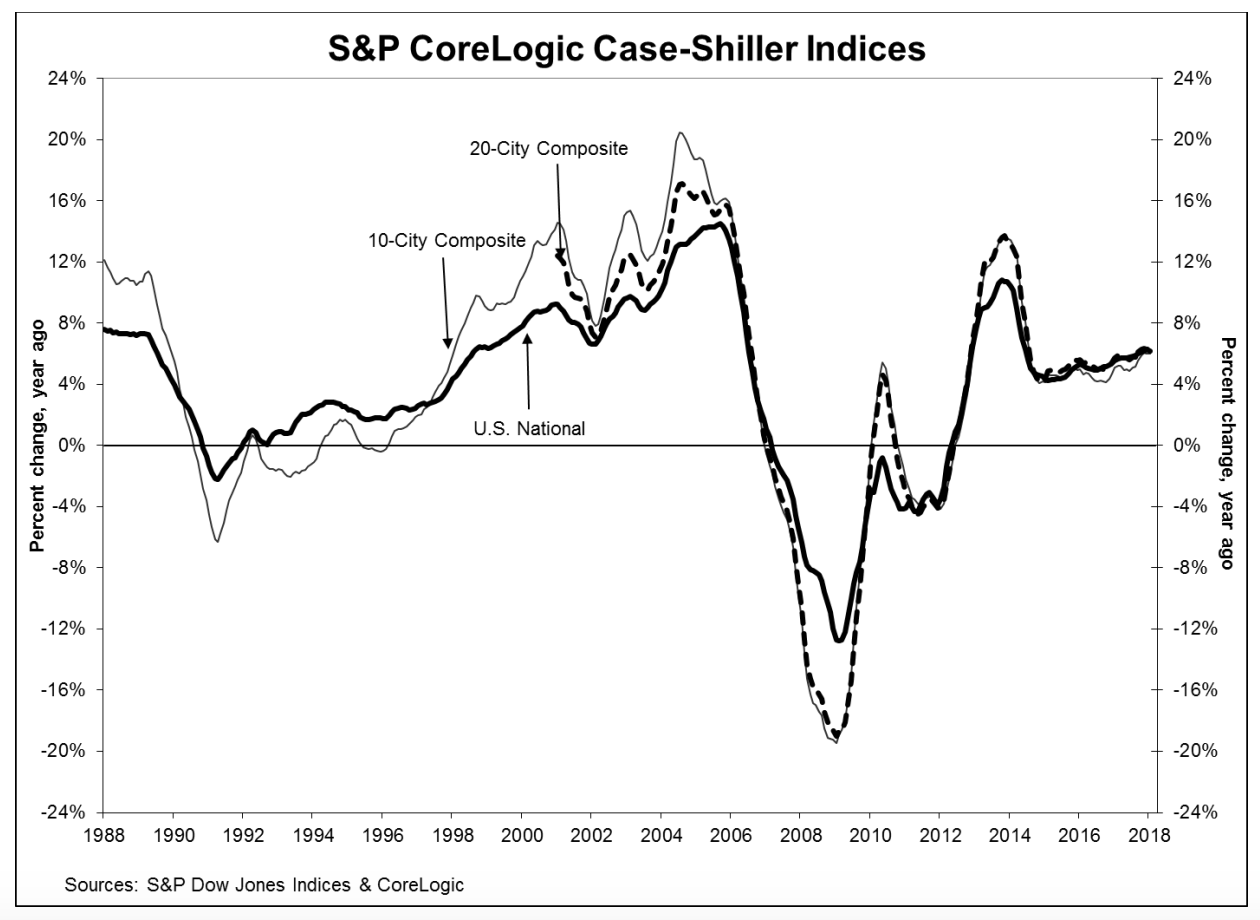
The 10-City Composite Index posted a 6.0 percent annual increase, the same as in December and the 20-City Composite change was 6.4 percent compared to 6.3 percent the previous month. Prices gained more in January than in December on an annual basis in 12 of the 20 cities in the two composites versus 8 in the 12 months ended in December.
Both Composites were up from December by 0.3 percent before seasonal adjustment. After adjustment the smaller composite rose 0.7 percent and the 20-City rose 0.8 percent. Sixteen of the 20 cities were higher in January before seasonal adjustment while all 20 cities were up on a seasonally adjusted basis.
Seattle, Las Vegas, and San Francisco had the greatest annual gains. Seattle continued to lead with an increase of 12.9 percent while prices in Las Vegas appreciated 11.1 percent. San Francisco's prices grew by 10.2 percent.
David M. Blitzer, Managing Director and Chairman of the Index Committee at S&P Dow Jones Indices provided the following commentary on the January report.
"Since the market bottom in December 2012, the S&P Corelogic Case-Shiller National Home Price Index has climbed at a 4.7 percent real inflation adjusted annual rate. That is twice the rate of economic growth as measured by the GDP. While price gains vary from city to city, there are few, if any, really weak spots. Seattle, up 12.9 percent in the last year, continues to see the largest gains, followed by Las Vegas up 11.1 percent over the same period. Even Chicago and Washington, the cities with the smallest price gains, saw a 2.4 percent annual increase in home prices.
"Two factors supporting price increases are the low inventory of homes for sale and the low vacancy rate among owner occupied housing. The current months supply - how many months at the current sales rate would be needed to absorb homes currently for sale - is 3.4; the average since 2000 is 6.0 months, and the high in January 2010 was 11.9. Currently the homeowner vacancy rate is 1.6 percent, compared to an average of 2.1 percent since 2000; it peaked in 2010 at 2.7 percent. Despite limited supplies, rising prices and higher mortgage rates, affordability is not a concern. Affordability measures published by the National Association of Realtors show that a family with a median income could comfortably afford a mortgage for a median priced home."
Case Shiller reports that all three of its indices are now back to winter 2007 levels. The National Index has surpassed its July 2006 peak by 6.3 percent. The 20-City Composite is within 0.7 percent of its peak while the 10-City lags by 3.2 percent.
The S&P CoreLogic Case-Shiller Home Price Indices are constructed to accurately track the price path of typical single-family home pairs for thousands of individual houses from the available universe of arms-length sales data. The National U.S. Home Price Index tracks the value of single-family housing within the United States. The indices have a base value of 100 in January 2000; thus, for example, a current index value of 150 translates to a 50 percent appreciation rate since January 2000 for a typical home located within the subject market.
The National Index new all record high in January was 196.31, up from the previous month's peak of 196.23. The 10- and 20-City Composites had readings of 219.05 and 205.10 respectively. Los Angeles claims the highest index reading at 273.28. Cleveland had the lowest reading at 117.29.


