
The Census Bureau and the Department of Housing and Urban Development today released New Residential Home Sales survey data for January 2010.
The survey is primarily based on a sample of houses selected from building permits. Since a “sale” is defined as a deposit taken or sales agreement signed, this can occur prior to a permit being issued. Changes in sales price data reflect changes in the distribution of houses by region, size, etc., as well as changes in the prices of houses with identical characteristics. It takes four months to establish a trend of new home purchases
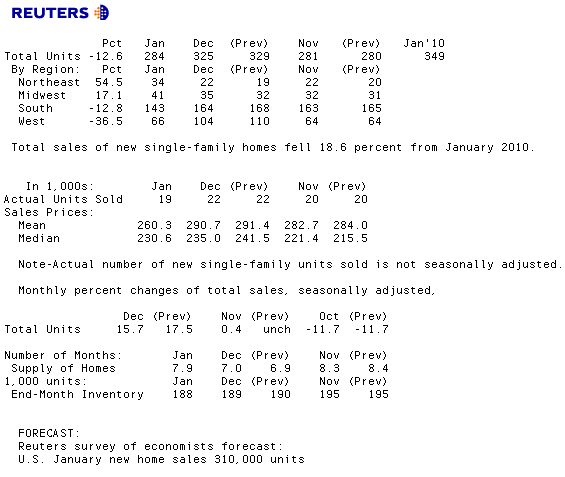
PREVIOUS REPORT: DECEMBER SURVEY DATA
Sales of new single-family houses in December 2009 were at a worse than expected seasonally adjusted annualized rate of 342,000. This was 7.6% below the revised for the better November rate of 370,000. An estimated 374,000 new homes were sold in 2009. This was 22.9% below the 2008 figure of 485,000 and a record low for annual new homes sales.
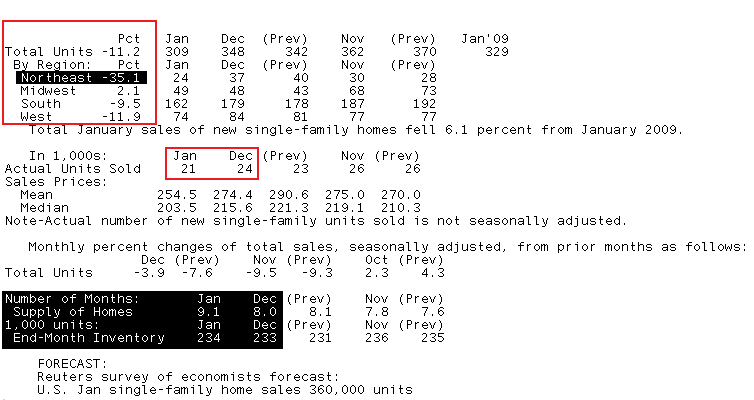
CURRENT RELEASE: JANUARY SURVEY DATA
Consensus Estimate: 360,000 annual sales
Result: -11.2% to 309,000 annual sales. Way Worse than Expected
The annual pace of New Home Sales fell to a new record low in January. This was the fourth consecutive month New Home Sales slid and the largest monthly percentage decline since January 2009. The chart below illustrates how seasonally adjusted New Home Sales have been unable to gain traction and maintain consistent positive progress.
Here is the text of the release:
Sales of new single-family houses in January 2010 were at a seasonally adjusted annual rate of 309,000, according to estimates released jointly today by the U.S. Census Bureau and the Department of Housing and Urban Development.
This is 11.2 percent (±14.0%)* below the revised December rate of 348,000 and is 6.1 percent (±15.1%)* below the January 2009 estimate of 329,000.
The median sales price of new houses sold in January 2010 was $203,500; the average sales price was $254,500. The seasonally adjusted estimate of new houses for sale at the end of January was 234,000. This represents a supply of 9.1months at the current sales rate.
Below is a table summarizing the data. While headlines will likely read "NEW HOME SALES HIT RECORD LOW", this might not be totally fair to the housing market as many folks will be leaning on foul wintry weather in the Northeast region as an excuse for weakness. Looking at geographic performance, the Northeast fell 35.1% in January, this is a much steeper decline than any other region experienced. So while we keep calling attention to structural weakness in housing demand, we do concede that weather may have played a role in the excessive amount of contraction that occurred in January. That said, the Northeast did not see its worst weather in January...the "thundersnow" and hurricane snow came in February.
What does that mean about next month's release? If weather really did have a big affect on New Home Sales in January...February should be worse.
Other than that, check out inventory stats. Number of supply grew from 8.0 months to 9.1 months. Again bad weather will likely take the blame for this...many will dismiss this report as a skewed, regardless of the fact that is already seasonally adjusted.
If you are one of those people who believe housing is coming out of the woods and setting up for a spring/summer surge in buying activity. READ MORE ABOUT THREATS TO THE HEALTH OF HOUSING


