
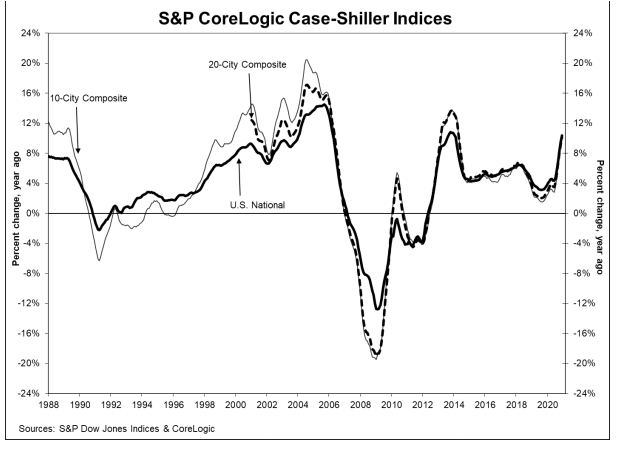
Both the S&P CoreLogic Case-Shiller and The Federal Housing Finance Agency (FHFA) report that the country ended the year with more than a 10 percent annual increase in home prices. The Case-Shiller U.S. National Home Price Index, which covers all nine U.S. census divisions, showed a year-over-year gain of 10.4 percent in December while FHFA put the increase at 11.4 percent.
The Case-Shiller National index showed significant acceleration in appreciation from the 9.5 percent reflected in its November report for the prior 12 months. The 10-City and 20-City appreciation was also faster than in November at 9.8 percent and 10.1 percent compared to 8.9 percent and 9.2 percent, respectively.
Phoenix, Seattle, and San Diego again had the greatest growth among the cities tracked. Phoenix led the way for the 19th month with a 14.4 percent year-over-year price increase, followed by Seattle, up 13.6 percent increase and San Diego with a 13.0 percent gain. Detroit continues to have insufficient transaction data available due to residual problems from earlier pandemic related office closures so only 19 cities are included in the indices. Eighteen of the 19 reported higher price increases in the year ending December 2020 versus the year ending November 2020.
The National Index was up 0.9 percent on a non-seasonally adjusted (NSA) basis from November while the 10-City Composite rose 0.9 percent and 20-City Composite 0.8 percent. After seasonal adjustment (SA) the National Index had a month-over-month increase of 1.3 percent, while the 10-City and 20-City Composites were up 1.2 percent and 1.3 percent. Eighteen cities reported increases before seasonal adjustment, while all 19 cities did so afterward.
Selma Hepp, CoreLogic Deputy Chief Economist provided the following comment regarding the December results. "With a full year of data, S&P CoreLogic Case-Shiller Index once again proved that 2020 was an unprecedented year in many ways, especially for the housing market. In December, the index surged at 10.4 percent - the first double-digit increase since January 2014. The month-to-month index also increased 0.85 percent, making it the strongest November- to-December increase since the data series began. The momentum in buyer demand that picked up speed during the second half of the year propelled through the end of the year, and seemingly into 2021. But acceleration in price growth is largely driven by record-low mortgage rates and the severe undersupply of for-sale home - two factors that may take a turn this year and relieve some of the price pressure. But demand from millennials and existing owners, who may have been on the sidelines throughout the pandemic, is likely to persist."
Craig J. Lazzara, Managing Director and Global Head of Index Investment Strategy at S&P DJI said, "The trend of accelerating prices that began in June 2020 has now reached its seventh month and is also reflected in the 10- and 20-City Composites (up 9.8 percent and 10.1 percent, respectively).
"As COVID-related restrictions began to grip the economy in early 2020, their effect on housing prices was unclear. Price growth decelerated in May and June, and then began a steady climb upward, and December's report continues that acceleration in an emphatic manner. 2020's 10.4 percent gain marks the best performance of housing prices in a calendar year since 2013. From the perspective of more than 30 years of S&P CoreLogic Case-Shiller data, December's year-over-year change ranks within the top decile of all reports.
"These data are consistent with the view that COVID has encouraged potential buyers to move from urban apartments to suburban homes. This may indicate a secular shift in housing demand or may simply represent an acceleration of moves that would have taken place over the next several years anyway. Future data will be required to address that question."
The S&P CoreLogic Case-Shiller Home Price Indices are constructed to accurately track the price path of typical single-family home pairs for thousands of individual houses from the available universe of arms-length sales data. The National U.S. Home Price Index tracks the value of single-family housing within the United States. The indices have a base value of 100 in January 2000; thus, for example, a current index value of 150 translates to a 50 percent appreciation rate since January 2000 for a typical home located within the subject market.
As of December 2020, the National Index was at 234.40 compared to 232.38 in November. The 10- and 20-City Composites had readings of 254.18 and 240.75 up from to 251.65 and 238.48 the prior month. Los Angeles has the highest index reading at 317.64 and Cleveland (absent data on Detroit) the lowest at 141.25.
The 11.4 percent price growth reported by FHFA was 0.04 point higher than the annual increase in November. The report also showed that the increase in the fourth quarter of 2020 was up 10.8 percent compared to the fourth quarter of 2019. Appreciation from the 3rd quarter to the 4th was 3.8 percent. FHFA said house prices have risen for 38 consecutive quarters, or since September 2011. The SA monthly index for the month was 1.1 percent higher than in November.
"House prices nationwide recorded the largest annual and quarterly increase in the history of the FHFA HPI," said Dr. Lynn Fisher, Deputy Director of FHFA's Division of Research and Statistics. "Low mortgage rates, pent up demand from homebuyers, and a limited housing supply propelled every region of the country to experience faster growth in 2020 compared to a year ago despite the pandemic. In particular, house prices in western states and cities saw the highest rates of growth, where annual gains often rose above 10 percent."
House prices rose in all 50 states and the District of Columbia between the fourth quarters of 2019 and 2020. The top five areas in annual appreciation were Idaho at 21.1 percent; Montana 15.5 percent; Utah 15.4 percent; Arizona 14.1 percent; and Connecticut 14.1 percent. Idaho has been the leading state for the last 9 quarters. Even at the lower end the gains were unusual. Louisiana was up 5.9 percent; Hawaii 6.1 percent; North Dakota 6.7 percent; and Illinois 7.7 percent. Only in the District of Columbia was appreciation unexceptional, up only 1.5 percent.
Among the nine census divisions, the Mountain division again had the strongest growth, 13.3 percent from Q4 2019 to the same quarter in 2020 and a 4.6 percent increase quarter-over-quarter. That division has led the nation for 13 consecutive quarters. Annual appreciation was weakest in the West South Central division, where prices rose by 8.6 percent between the fourth quarters of 2019 and 2020.
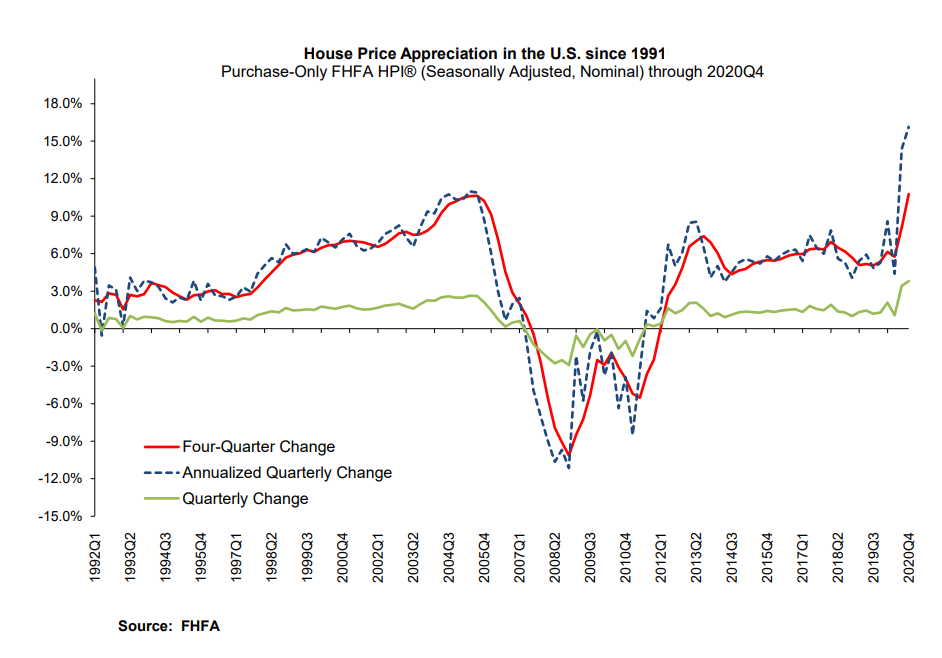
FHFA's House Price Index is based on the sales prices of homes financed by the GSEs Fannie Mae and Freddie Mac. The index was benchmarked at 100 in January 1991. The index value in December was 313.5.


