
We are seeing more and more CEOs looking for accurate and concise information about their companies to help detect positive and negative trends.
Rather than shifting through hoards of reports and data, they would rather have a one page “Dashboard” that shows the key drivers, metrics and financial results of their operation. Additionally, we find most CEOs have a little ADD and like visual pictures instead of a page of boring data. There is a Chinese proverb that says “One picture is worth a thousand words”. I might add it’s worth a thousand numbers as well.
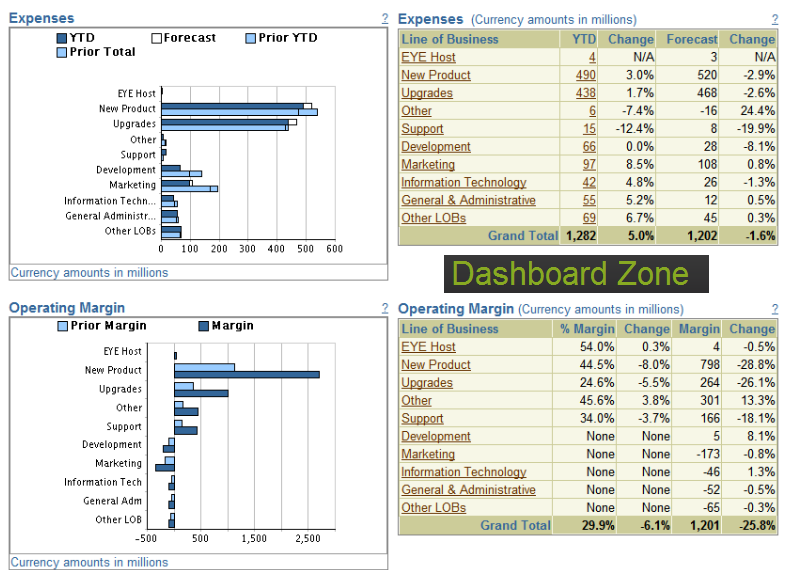
The following is an example of a Dash Board I pulled off of DashboardZone.com:
This week I spent a day with an owner/CEO of a mid size mortgage company in Northern California where we performed an annual FOCIS-Plus Study on his company.
One of the key findings was his desire to have a one page “Dashboard” that provided him a quick snap shot of the performance and trends of his operation. His team had created a one page report last year, but it was busy with two dozen small boxes of data on a legal size paper. The data was interesting, but it really didn’t provide him a quick “temperature read” of the company. We spent an hour white boarding the key metrics he wanted to see and measure. By the end of this week, he will have a one letter page “Dashboard” that will show his metrics in a graphic format.
Every CEO has certain drivers they are interested in looking at daily. Some operators are production driven and want to review lock, submission and funding activity. Others are financial oriented and want revenues broken out by channel, products and investors. And some CEOs are focused on productivity and expenses. All of these are important and any or all of these drivers can be displayed for a CEO in a concise and readable format.
One of the key requirements for building a “Dashboard” is to ensure there is accurate data and it can be obtained easily. Most mortgage bankers have a decent platform that allows data to be exported into Excel. A good Dashboard starts with the CEO indentifying the information he wants and including him in the design.


