
The old adage about waiting for the kettle to boil could be applied to the widely predicted deceleration of home price appreciation. It seems to be happening, but it isn't fast. The S&P CoreLogic Case-Shiller price indexes showed slightly lower monthly and annual gains in September than in August while the Federal Housing Finance Agency's (FHFA's) House Price Index (HPI) was unchanged from the previous report on an annual basis but down fractionally month-over-month.
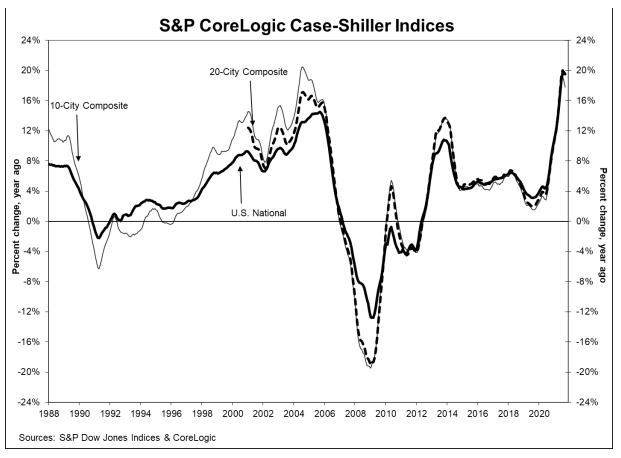
Case-Shiller's National Home Index, covering all nine U.S. census divisions, reported a 19.5 percent annual gain in September, down from 19.8 percent in August. The 10-City Composite grew by 17.8 percent compared to 18.6 percent in the previous month and the 20-City Composite posted a 19.1 percent year-over-year gain, a half-point below the August appreciation rate.
Phoenix, Tampa, and Miami had the highest year-over-year gains among the 20 cities in September. Phoenix led the way with a 33.1 percent year-over-year price increase, its 28th straight month at the top of the chart. Tampa moved from third to second place with a 27.7 percent increase and Miami knocked San Diego out of the top three increases by 25.2 percent. Six of the 20 cities reported larger gains for the year ending in September than the year ending August 2021.
Before seasonal adjustment, the U.S. National Index posted a 1.0 percent month-over-month increase while the 10-City and 20-City Composites both posted increases of 0.7 percent and 0.8 percent, respectively.
After seasonal adjustment, the U.S. National Index posted a month-over-month increase of 1.2 percent, and the 10-City and 20-City Composites both posted increases of 0.8 percent and 1.0 percent, respectively. In September, 19 of the 20 cities reported increases before seasonal adjustments while all 20 cities reported increases after seasonal adjustments.
CoreLogic Deputy Chief Economist Selma Hepp noted the trend toward smaller price gains. "In addition to seasonal slowing in the housing market, recent S&P CoreLogic Case-Schiller data suggests that the monthly rate of home price acceleration has similarly decelerated since the summer peak," she said. "Nevertheless, home prices continue to post near 20 percent annual gains. However, the slowing of monthly price acceleration while home purchase activity remains strong suggests that the market is trending toward a healthier balance between buyers and sellers. In the coming months, we are likely to see a continued slowing of monthly and annual home price gains while total 2021 home purchases will outpace last year's purchases."
Craig J. Lazzara, Managing Director at S&P Dow Jones Indices commented, "If I had to choose only one word to describe September 2021's housing price data, the word would be 'deceleration.' Housing prices continued to show remarkable strength in September, though the pace of price increases declined slightly. Each of our three composites rose less in September than in August.
"We also saw very strong price growth at the city level. All 20 cities saw price increases in September, and all 20 cities stand at their all-time highs. September's price increase ranked in the top quintile of historical experience for all 20 cities, and in the top decile for 17 of them. That said, in 14 of 20 cities, prices decelerated - i.e., increased by less in September than in August.
"We have previously suggested that the strength in the U.S. housing market is being driven by households' reaction to the COVID pandemic, as potential buyers move from urban apartments to suburban homes. More data will be required to understand whether this demand surge represents simply an acceleration of purchases that would have occurred over the next several years, or reflects a secular change in locational preferences. September's report is consistent with either explanation."
The S&P CoreLogic Case-Shiller Home Price Indices are constructed to accurately track the price path of typical single-family home pairs for thousands of individual houses from the available universe of arms-length sales data. The National U.S. Home Price Index tracks the value of single-family housing within the Uni0ted States. The indices have a base value of 100 in January 2000; thus, for example, a current index value of 150 translates to a 50 percent appreciation rate since January 2000 for a typical home located within the subject market.
As of September, the National Index was at 271.18 compared to 266.62 in August. The 10- and 20-City Composites had readings of 289.20 and 277.24, up from 287.17 and 274.99 the prior month. Los Angeles continues to have the highest index reading at 365.55 while Detroit and Cleveland continue to trade off on a monthly basis. Cleveland fell into last place in September with a reading of 157.75.
FHFA reports its HPI rose 18.5 percent from the third quarter of 2020 to the third quarter of 2021, the same increase as the annual gain reported in August. Prices from the second quarter to the third quarter of this year were up 4.2 percent and the monthly gain was 0.9 percent compared to 1.0 percent growth in August.
"House price appreciation reached its highest historical level in the quarterly series," said William Doerner, Ph.D., Supervisory Economist in FHFA's Division of Research and Statistics. "Compared to a year ago, annual gains have increased in every state and metro area. Real estate prices have risen exceptionally fast, but market momentum peaked in July as month-over-month gains have moderated."
FHFA's housing index has posted annual appreciation every quarter since the start of 2012. In the third quarter of 2021 the five states with the greatest annual growth were Idaho, 35.8 percent; Utah, 30.3 percent; Arizona 27.7 percent; Montana, 26.0 percent; and Florida, 24.8 percent.
As is obvious from the list of leading states, the Mountain division led all nine census divisions with a 25.0 percent increase from Q3 2020 to the same quarter this year. Appreciation was weakest in the West North Central division at 14.8 percent.
FHFA's price data is based on the sales prices of homes financed by either Fannie Mae or Freddie Mac. The HPI was benchmarked at 100 in January 1991. In September, the index was at 354.61.


