For the second consecutive month the Home Price Index (HPI) published by CoreLogic posted a decline. The September HPI decreased 1.1 percent compared to August figures. National home prices, including distressed sales, also declined year-over-year and are now 4.1 percent lower than in September 2010. This was also the second straight month the numbers were down on an annual basis; revised August 2011 figures were down 4.4 percent from the same period one year earlier. When distressed sales including short sales and real estate owned (REO) are removed from the equation the year-over-year figures reflect a 1.1 percent decline in September and a 2.2 percent loss in August.
The losses were felt nationwide. Eighty-two of the top 100 Core Based Statistical Areas (CBSAs) as measured by population showed year-over-year losses in both August and September.
"Even with low interest rates, demand for houses remains muted. Home sales are down in September and the inventory of homes for sale remains elevated. Home prices are adjusting to correct for the supply-demand imbalance and we expect declines to continue through the winter. Distressed sales remain a significant share of homes that do sell and are driving home prices overall," said Mark Fleming, chief economist for CoreLogic.
Since the peak in the National HPI which was recorded in April 2006, the HPI including distressed transactions has declined 31.2 percent. When distressed transactions are excluded, the HPI for the same period was 21.9 percent.
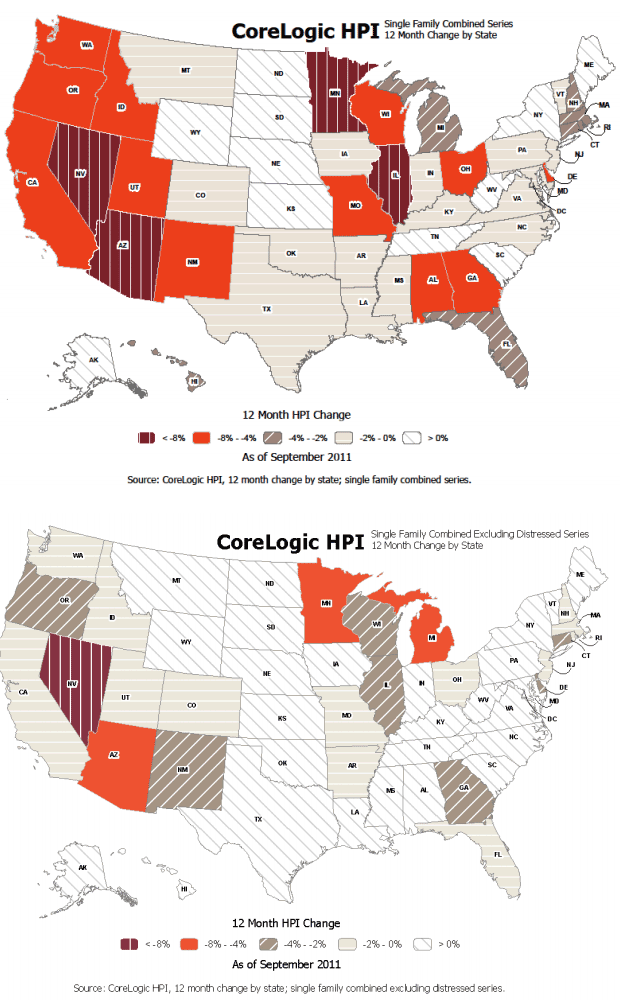
The states with the highest appreciation in the HPI including distressed sales were West Virginia, Wyoming, South Dakota, Main, and North Dakota and excluding HPI, West Virginia, Main, Wyoming, Montana, and Kansas. The states that saw the greatest decrease in the HPI including distressed sales were Nevada, Illinois, Arizona, Minnesota, and Georgia. Excluding distressed sales the biggest depreciation was in Nevada, Arizona, Minnesota, Michigan, and Delaware.
The CoreLogic HPI provides a multi-tier market evaluation based on price, time between sales, property type, loan type (conforming vs. nonconforming), and distressed sales. The CoreLogic HPI is a repeat-sales index that tracks increases and decreases in sales prices for the same homes over time incorporating more than 30 years' worth of repeat sales transactions representing more than 65 million observations.