Foreclosure activity increased during the third quarter of 2011, driven largely by a spike in early filings in August. Data for September showed a return to the trends reported in earlier months. This information came Thursday in quarterly U.S. Foreclosure Market Report issued on Thursday by RealtyTrac. The report also includes statistics on September activity.
The Irvine, California firm issues regular reports on foreclosure activity throughout the United States, tracking foreclosure filings in three categories:
- Notice of Default (NOD) and Lis Pendens (LIS). This is the first legal notification from a lender that the borrower on a mortgage loan has defaulted under the terms of their mortgage and the lender intends to foreclose unless the loan is brought current.
- Auction - Notice of Trustee Sale and Notice of Foreclosure Sale (NTS and NFS): if the borrower does not catch up on their payments the lender will file a notice of sale (the lender intends to sell the property). This notice is published in local paper and contains information pertaining to the date, time and subject property address.
- Real Estate Owned or REO properties :
"REO" stands for "real estate owned" and typically
refers to the inventory of real estate that banks and mortgage companies
have foreclosed on and subsequently purchased through the foreclosure
auction if there was no offer higher than the minimum bid.
There were foreclosure filings on 610,337 properties during the third quarter, an increase of 0.35 percent over Quarter Two and a drop of 34 percent from the third quarter of 2010. One out of every 213 U.S. housing units received some type of foreclosure filings during the third quarter.
During September there were 214,855 filings affecting one in every 605 homes. This was a decrease of 6 percent since August and was 38 percent lower than September 2010. This was the sixth straight month when the filing rate was lower than it had been one year earlier.
Default notices were filed on 195,878 properties in the third quarter up 14 percent from the second quarter. Much of the increase occurred in August which set a nine month high in this category. September filings totaled 70,710, down 10 percent from the August numbers. Year-over-year comparisons improved for both quarterly and monthly data. Quarterly filings were 27 percent lower than Q3 2010 and September's numbers were down 31 percent from the same period a year earlier.
During the quarter foreclosure auctions were scheduled for the first time on 217,929 properties, 79,098 of these filings were in September. The second quarter figures were down quarter over quarter and year-over-year by 6 percent and 41 percent respectively and September's figures were down 6 percent from August and 45 percent from one year earlier.
Foreclosures were completed on 196,530 properties during the quarter, 4 percent less than in Q2 and nearly one third less than a year earlier. Foreclosures in September totaled 65,047; an increase of less than 1 percent from August and down 36 percent from September 2010 which was the peak month for bank repossessions in RealtyTrac's reporting history.
The timeline for all processes related to foreclosures continues to grow. RealtyTrac found that it now takes 336 days to complete the foreclosure process compared to 318 days in the second quarter. The time required to sell property keeps climbing as well. It took a record high average of 318 days during the quarter to sell a property in process of foreclosure - usually via a short sale - compared to 245 days in the second quarter. REO sales were occurring, on average, 193 days after the banks took possession of the property compared to 178 in the previous quarter.
"U.S. foreclosure activity has been mired down since October of last year, when the robo-signing controversy sparked a flurry of investigations into lender foreclosure procedures and paperwork," said James Saccacio, chief executive officer of RealtyTrac. "While foreclosure activity in September and the third quarter continued to register well below levels from a year ago, there is evidence that this temporary downward trend is about to change direction, with foreclosure activity slowly beginning to ramp back up.
"Third quarter foreclosure activity increased marginally from the previous quarter, breaking a trend of three consecutive quarterly decreases that started in the fourth quarter of 2010," Saccacio continued. "This marginal increase in overall foreclosure activity was fueled by a 14 percent jump in new default notices, indicating that lenders are cautiously throwing more wood into the foreclosure fireplace after spending months spent trying to clear the chimney of sloppily filed foreclosures."
It took an average of 986 days to foreclose on a property in New York, the longest of any state and a record high for the state. The second longest average foreclosure process was in New Jersey, at 974 days, and the third longest average foreclosure process was 749 days in Florida. In contrast, the Texas average is 86 days and in Tennessee a typical foreclosure takes 94 days.
As usual Nevada, California, and Arizona were the most active states for foreclosure filings although the numbers are shrinking in all three states. The incidence of filings was one in 44 in Nevada, one in 88 in California and one in 93 in Arizona. Other states with high rates of filings were Georgia, Florida, Utah, Michigan, Idaho, Illinois, and Colorado.
Several states bucked the national trend with significant quarterly increases in REO activity during the quarter. These states and their quarter-over-quarter increases are Massachusetts (62 percent); Oregon (47 percent); Georgia (42 percent); and Illinois (27 percent).
There were also large increases in default notices during the quarter: Massachusetts (65 percent); New Jersey (29 percent); Florida 24 percent); Ohio and California (21 percent each).
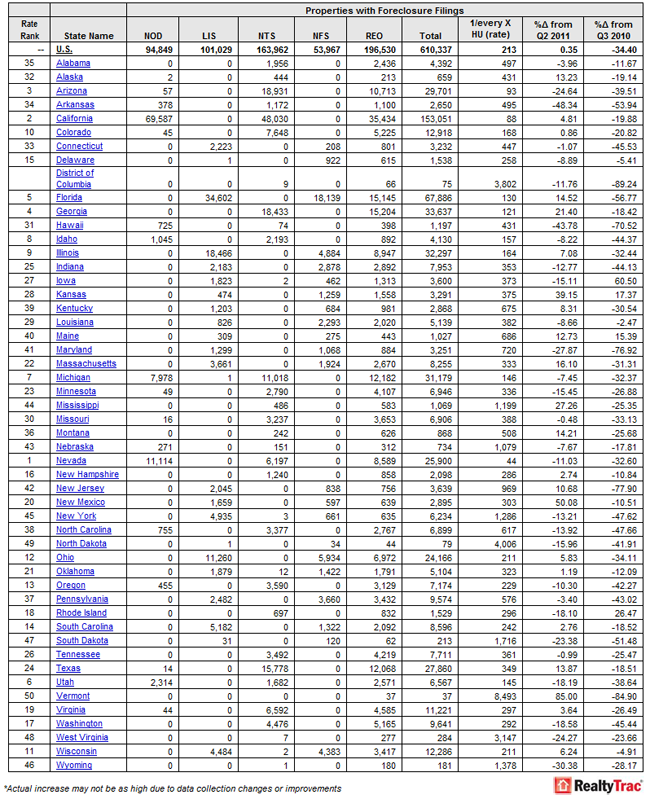
U.S. Foreclosure Market Data by State – Q3 2011