
Is relief in sight for potential homeowners? Too early to tell, but Black Knight says that the rate of acceleration in home price growth did slow slightly in August, the first decline in the annual rate in 15 months. The company's Mortgage Monitor, covering mortgage loan performance data for the month, reports that the annual appreciation in August was 19.0 percent compared to 19.4 percent over the 12 months that ended in July.
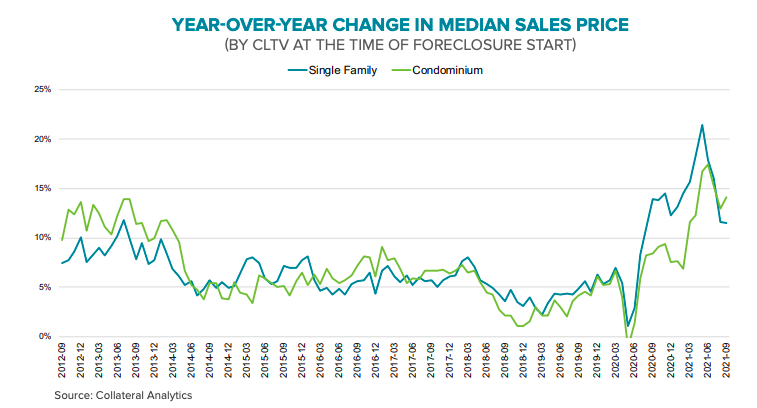
Price growth slowed for single-family houses from 20 percent to 19.5 percent while the appreciation rate for condo units dipped from 15.4 to 15.2 percent. Deceleration in increases is, of course, reflected more quickly in the month-over-month data, and there the slowdown has been evident for several months. August prices were up by 0.9 percent from those in July. The monthly increase was near 3 percent earlier this year.
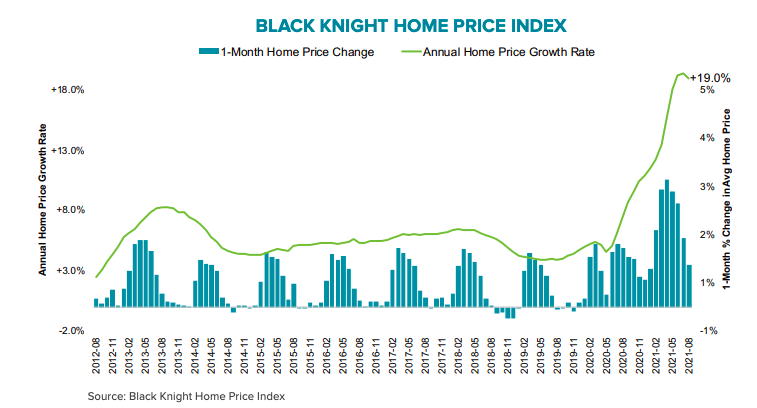
Black Knight says the August cooling, however slight, may be a sign of a broader downshift in the housing market. Still, the August increase was roughly twice the historical appreciation for the month.
September through January typically display a lull in home price growth and the company says early tracking of September price data shows a decline in the median single-family sales price during the first half of the month to a more modest annual growth of 11.5 percent.
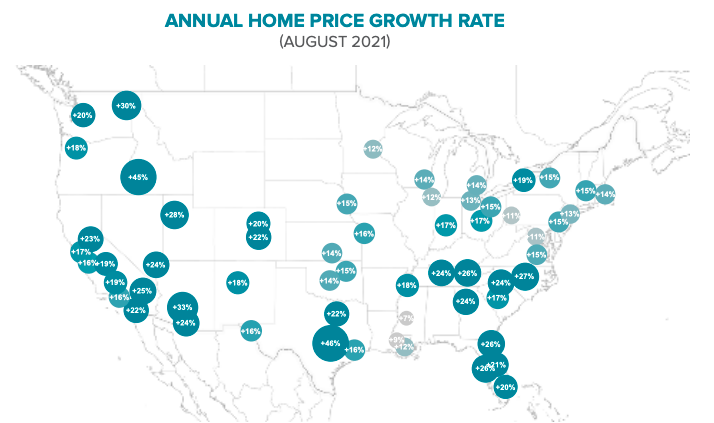
Prices continue to increase by an annual rate of 10 percent through most of the country, but there are geographic variations. Gains are more modest in the Midwest and Northeast while price growth is sometimes twice that in parts of the Southeast and in the Rocky Mountain area. For example, among the top 50 metropolitan areas, Austin prices grew 45.8 percent year-over-year while Pittsburgh had the smallest increase at 10.8 percent.
As prices have risen, potential homebuyers have seen the monthly payment required to purchase the average priced home with a 20 percent down 30-year fixed rate mortgage increase by more than $210 or 20 percent over the first nine months of 2021, bringing the average monthly mortgage payment to its highest level since late 2007.
Black Knight estimates it now requires 21.6 percent of the median household income to pay the monthly bill for the average home purchase, making housing the least affordable it's been since 30-year rates rose to nearly 5 percent in late 2018. The company reminds that, since the Great Recession, a payment-to-income (PTI) ratio of 20.5 percent generally has been the point at which home price growth begins to slow. However, in the recent timeframe, low inventory has continued to stoke prices, trumping tightening affordability.
The prospect of interest rates increases, which the Federal Reserve is hinting may occur earlier than expected, will only exacerbate the affordability side of the equation. The company says, should interest rates rise to 3.5 percent with no change in home prices or household incomes, the average monthly payment would go up $100 and affordability would drop to a 12-year low. At a 4.0 percent rate the PTI would climb above its pre-Great Recession (1995-2003) average. At 5.0 percent, where rates were in late 2018, the price increases since then would push the monthly payment up $380 from current levels, making the average priced home less affordable than at any time other than during the 2004-2008 housing boom.

Black Knight says that "Historically low interest rates have made today's home prices manageable from an affordability perspective, but a sharp rise in rates unaccompanied by comparable income growth could tip the balances, underscoring the tightrope the Fed must walk as it looks to exit its accommodative stance in coming quarters.
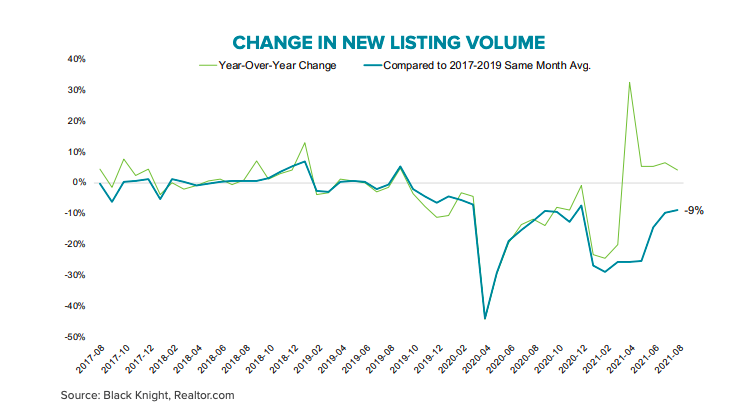
There was a shred of hope for potential homebuyers on the inventory front. The Monitor says the number of homes that came on the market in August was up by 4 percent from the same month in 2020. This is still 9 percent fewer than the average number of new listings during the month in the pre-pandemic years of 2017 through 2019.
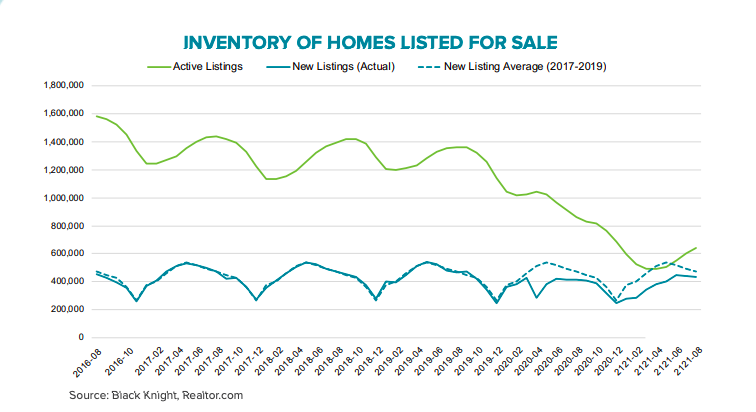
This suggests that inventories will continue to fall short of demand, but that national shortfall has narrowed from the 25 to 30 percent deficits seen earlier in the year. Still, there are only about half the active listings as would be normal for this time of year.
Some major (and pricey) West Coast markets are exceptions to the inventory stresses. San Francisco, Sacramento, Los Angeles, San Jose, and Riverside all have inventory levels ahead of where they were before the pandemic.
This month's Monitor also analyzes some potential outcomes as homeowners approach the end of their forbearance terms. This will be covered in conjunction with a report from CoreLogic on the same topic.


