
Both of the major home price indexes that were released this morning showed continued deceleration in the rate of appreciation, even though July is usually one of the strongest months of the year for home price gains. The Federal Housing Finance Agency's (FHFA's) House Price Index (HPI) and most variations of the three of the S&P CoreLogic Case Shiller Indices turned in slightly smaller increases in July than in June, both month-over-month and on an annual basis.
The Case-Shiller National Index which covers all nine U.S. Census districts, reported prices were up 6.0 percent compared to July 2017. Last month's June to June comparison put the gain at 6.2 percent. The monthly figures also softened. Before seasonal adjustment, the Index posted a gain of 0.4 percent. and 0.2 percent after adjustment. The June number were 0.8 percent and 0.3 percent.
The 10-City Composite index was up 5.5 percent for the 12 months ended in July and the 20-City Composite rose 5.9 percent. Each gain was 0.5 point smaller than 12-month increase in June. The 10-City and 20-City Composites reported month over month increases of 0.2% and 0.3%respectively before seasonal adjustment (compared to 0.4 and 0.5 percent the previous month). After adjustment the 10-City was flat, and the 20-City Composite rose 0.1 percent compared to an 0.1 percent change for each the previous month. Eighteen of 20 cities reported increases in June before seasonal adjustment, while 13 of 20 cities reported increases after seasonal adjustment.
Going into July Econoday said the 20-City, which is the component it tracks, had missed its consensus estimate for four straight months. This sort of makes it five. While the seasonally adjusted number came in where forecast, up 0.1 percent, Econoday's analysts had expected a non-adjusted 0.5 percent increase and a year-over-year gain of 6.3 percent.
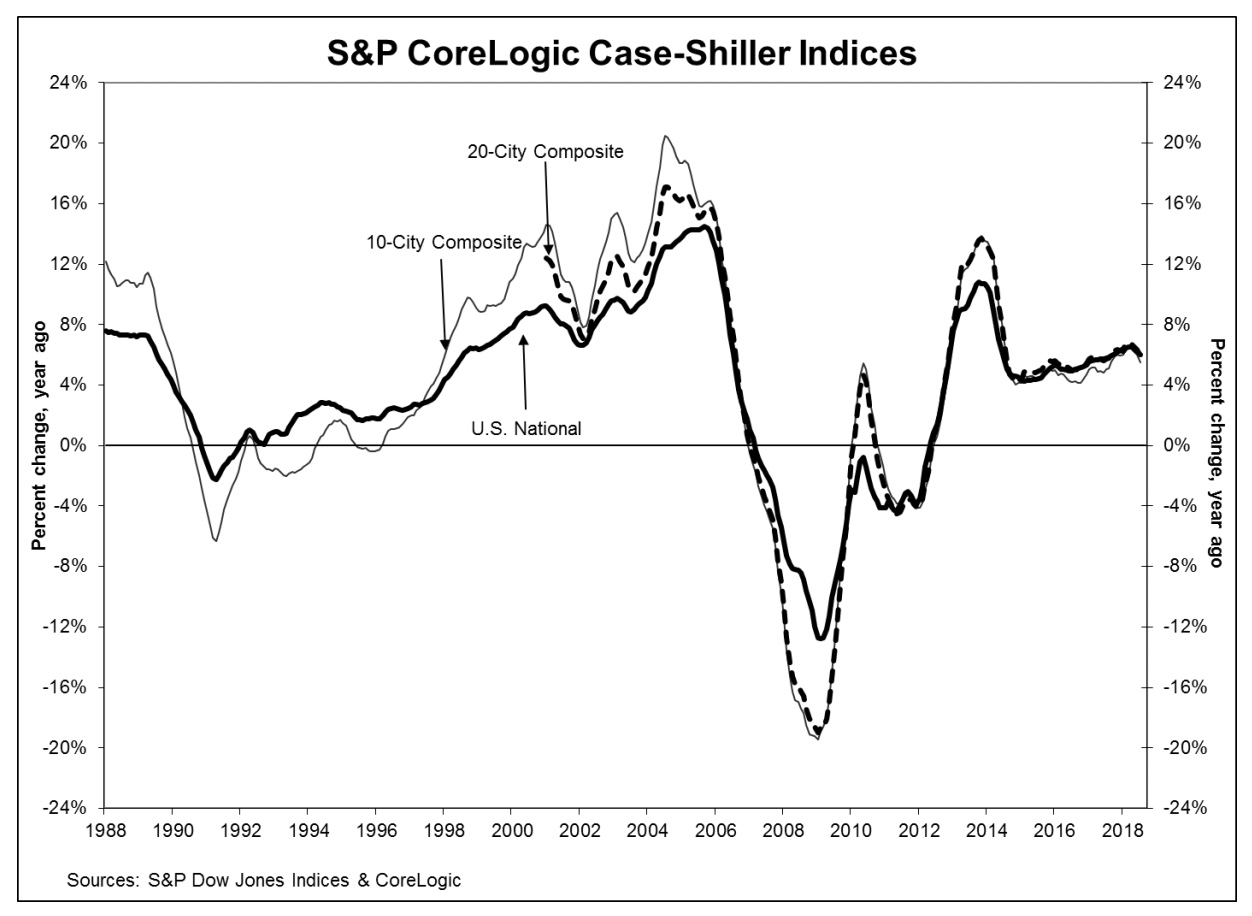
Las Vegas, Seattle and San Francisco continued to report the highest year-over-year gains among the 20 cities. Las Vegas led the way for the second month with a 13.7 percent year-over-year price increase, followed by Seattle and San Francisco, up 12.1 percent and 10.8 percent respectively. Five of the 20 cities reported greater price increases in the year ending July 2018 versus the year ending June 2018.
"Rising homes prices are beginning to catch up with housing," says David M. Blitzer, Managing Director and Chairman of the Index Committee at S&P Dow Jones Indices. "Year-over-year gains and monthly seasonally adjusted increases both slowed in July for the S&P Corelogic Case-Shiller National Index and the 10 and 20-City Composite indices. The slowing is widespread: 15 of 20 cities saw smaller monthly increases in July 2018 than in July 2017. Sales of existing single family homes have dropped each month for the last six months and are now at the level of July 2016. Housing starts rose in August due to strong gains in multifamily construction. The index of housing affordability has worsened substantially since the start of the year.
"Since home prices
bottomed in 2012, 12 of the 20 cities tracked by the S&P Corelogic
Case-Shiller indices have reached new highs before adjusting for inflation. The
eight that remain underwater include the four cities which led the home price
boom: Las Vegas, Miami, Phoenix and
Tampa. All are enjoying rising prices, especially Las Vegas which currently has
the largest year-over-year increases of all 20 cities. The other cities where
prices are still not over their earlier peaks are Washington DC, Chicago, New
York and Atlanta. "
As of July, the average home prices for the metropolitan statistical areas within the two composites are back to their winter 2007 levels. The National Index is now 11.2 percent higher than its peak in the summer of 2006 and the 20-City is 3.5 percent higher. The 10-City Composite has also now topped its pre-crash high and is up 0.3 percent from its prior record.
FHFA's HPI is also showing some weakness. It rose 0.2 percent compared to June although the June gain, originally estimated at 0.2 percent was revised to 0.3 percent. On an annual basis home prices rose 6.4 percent compared to the 6.5 percent posted for June.
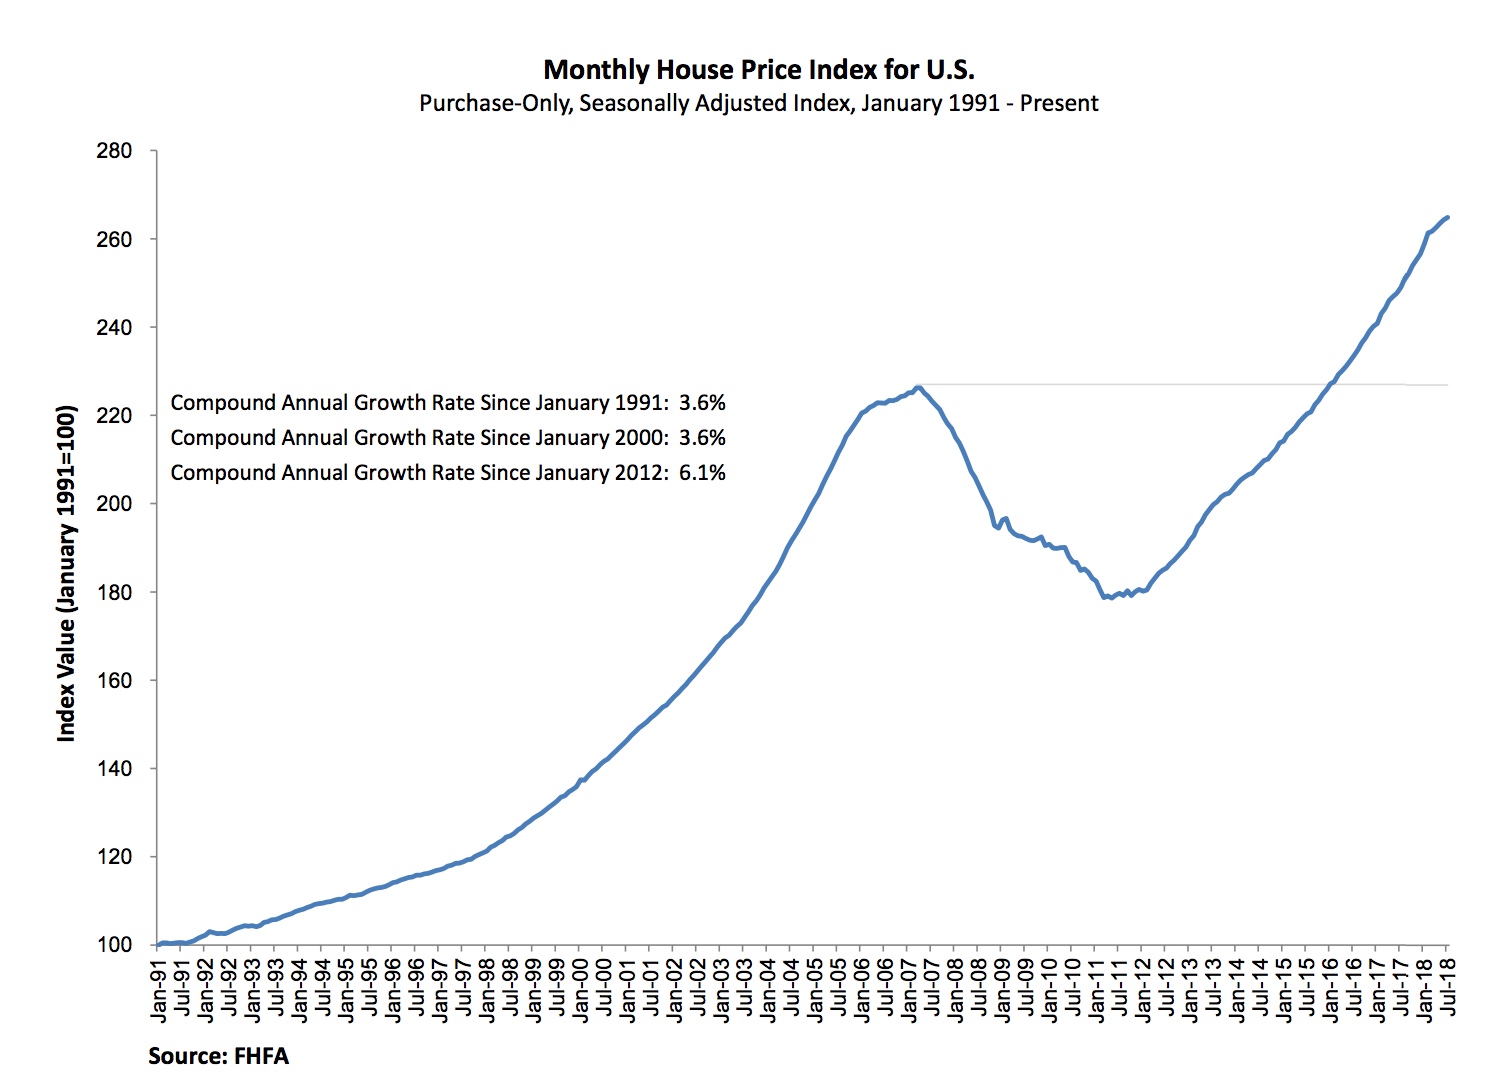
Of the nine census divisions three saw price fall. The East and the West South Central, were down compared to June by 0.5 and 0.1 percent respectively and the Mid-Atlantic dropped 0.2 percent. The largest gain was 0.2 percent in the Pacific Division. The monthly gains were smaller than June's in every division except the South Atlantic. Year-over-year changes ranged from 4.7 percent in New England to 8.7 percent in the Mountain Division.
The FHFA monthly HPI is calculated using home sales price information from mortgages sold to, or guaranteed by, Fannie Mae and Freddie Mac. The Index was benchmarked to 100 in January 1991 and was at 265.0 in July.
The S&P CoreLogic Case-Shiller Home Price Indices are constructed to accurately track the price path of typical single-family home pairs for thousands of individual houses from the available universe of arms-length sales data. The National U.S. Home Price Index tracks the value of single-family housing within the United States. The indices have a base value of 100 in January 2000; thus, for example, a current index value of 150 translates to a 50 percent appreciation rate since January 2000 for a typical home located within the subject market.
The National Index set another new record in July, a reading of 205.35. June's peak was 204.48 . The 10- and 20-City Composites had readings of 227.05 and 213.76 respectively. Los Angeles claims the highest index at 283.20. Cleveland had the lowest reading at 123.57.


