
The superlatives are getting tired - historic, record setting - but they have to come into play again with the March home price gains. A spokesperson for S&P CoreLogic Case-Shiller called the annual gains in those indices the highest in 15 years while the Federal Housing Finance Agency (FHFA) said the growth in its data was more than twice that posted a year earlier.
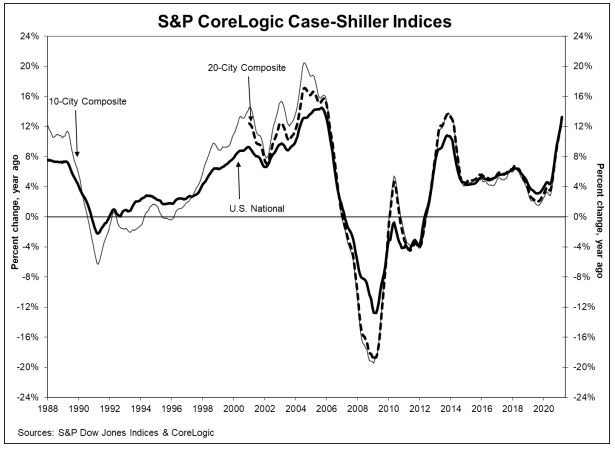
The Case-Shiller National Home Price Index increased at an annual rate of 13.2 percent in March, 1.2 point higher than the annual rate in February. The 10-City Composite Index rose 12.8 percent compared to 11.7 the prior month while the increase in the 20-City Composite was 13.3 percent, up from 12.0 percent.
On a month-over-month basis, the National Index rose 1.5 percent on a seasonally adjusted basis and 2.0 percent unadjusted. The 10-City and 20-City Composites posted increases of 2.0 percent and 2.2 percent respectively before adjustment and 1.4 percent and 1.6 percent afterward. All 20 cities had monthly gains, both before and after seasonal adjustments.
Phoenix, San Diego, and Seattle saw the largest year-over-year gains again in March. For the 22nd straight month the greatest appreciation was in Phoenix at 20.0 percent, followed by San Diego at 19.1 percent and Seattle with an 18.3 percent increase. All 20 cities reported higher price gains in the year ending March 2021 versus the year ending February 2021. Prices were strongest in the West with a regional increase of 15.1 percent, but every region rose by double-digits.
"Massive home buying demand shows no signs of abating despite some rise in mortgage rates and concerns of overheated home price growth," CoreLogic Deputy Chief Economist Selma Hepp said. "At the same time, hopes that new listings would proliferate as mass vaccinations encourage baby boomers to list their homes is showing little signs of taking place. Thus, pressures on home prices continued to mount and S&P CoreLogic Case-Shiller Index surged 13.2 percent year over year in March. The month-to-month index jumped 1.95 percent, making it the strongest February-to-March increase in recorded history of data."
Craig J. Lazzara, Managing Director and Global Head of Index Investment Strategy said, "Housing prices continued to rise robustly in March 2021. The National Composite Index marked its tenth consecutive month of accelerating prices. The market's strength is broadly-based: all 20 cities rose, and all 20 gained more in the 12 months ended in March than they had gained in the 12 months ended in February.
"More than 30 years of S&P CoreLogic Case-Shiller data put these results into historical context. The National Composite's 13.2 percent gain was last exceeded more than 15 years ago in December 2005, and lies very comfortably in the top decile of historical performance. The unusual strength is reflected across all 20 cities; March's price gains in every city are above that city's median level, and rank in the top quartile of all reports in 19 cities.
"These data are consistent with the hypothesis that COVID has encouraged potential buyers to move from urban apartments to suburban homes. This demand may represent buyers who accelerated purchases that would have happened anyway over the next several years. Alternatively, there may have been a secular change in preferences, leading to a permanent shift in the demand curve for housing. More time and data will be required to analyze this question.
The S&P CoreLogic Case-Shiller Home Price Indices are constructed to accurately track the price path of typical single-family home pairs for thousands of individual houses from the available universe of arms-length sales data. The National U.S. Home Price Index tracks the value of single-family housing within the United States. The indices have a base value of 100 in January 2000; thus, for example, a current index value of 150 translates to a 50 percent appreciation rate since January 2000 for a typical home located within the subject market.
As of March 2021, the National Index was at 243.66 compared to 238.83 in February. The 10- and 20-CityComposites had readings of 264.77 and 251.66, up from to 259.50 and 246.04 the prior month. Los Angeles has the highest index reading at 332.91. Detroit ousted Cleveland from the bottommost post on the index at 144.27.
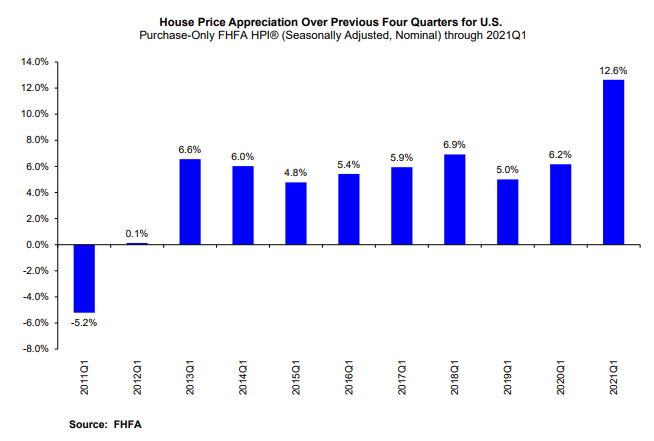
FHFA's House Price Index (HPI) puts the annual increase in March at 12.6 percent with a 3.5 percent increase in the first quarter of 2021 compared to the fourth quarter of 2020. Prices grew by 1.4 percent month-over-month. House prices have risen every quarter since September 2011, 39 consecutive quarters.
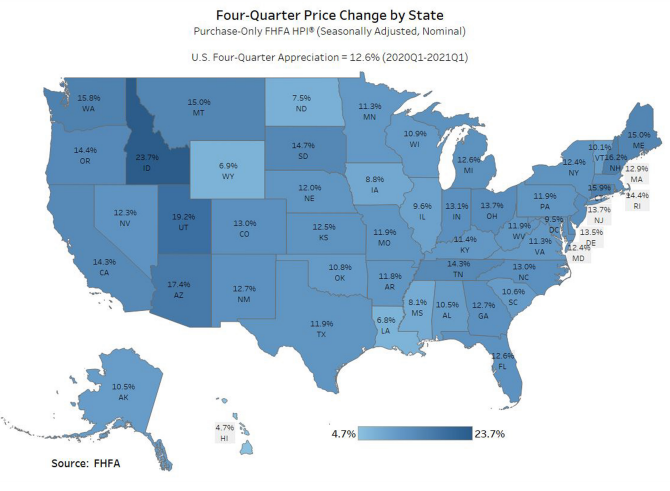
"House price growth over the prior year clocked in at more than twice the rate of growth observed in the first quarter of 2020, just before the effects of the pandemic were felt in housing markets," said Dr. Lynn Fisher, Deputy Director of FHFA's Division of Research and Statistics. "In March, rates of appreciation continued to climb, exceeding 15 percent over the year in the Pacific, Mountain and New England census divisions."
House prices rose in all 50 states and the District of Columbia between the first quarters of 2020 and 2021 with the greatest appreciation in Idaho (23.7 percent), Utah (19.2 percent), Arizona 17.4 percent), New Hampshire and Connecticut (16.2 and 15.9 percent, respectively.) The smallest gains were in Hawaii, Louisiana, Wyoming, North Dakota, and Mississippi, all below 8.2 percent. Prices were up in 99 of the 100 largest metro areas, declining only in Urban Honolulu.
Of the nine census divisions, the Mountain division experienced the strongest four-quarter appreciation, posting a 15.7 percent gain between the first quarters of 2020 and 2021 and a 4.8 percent increase in the first quarter of 2021. That division has led in annual growth for 14 quarters. Appreciation was weakest in the West South Central division, but prices still were up by 11.1 percent between the first quarters of 2020 and 2021.
FHFA's HPI is based on the sales prices of homes purchased using financing from either Fannie Mae or Freddie Mac. The Index was benchmarked in January 1991 at 100 and was at 324.9 in March.


