
The Commerce Department released January New Residential Construction: Building Permits, Housing Starts, and Housing Completions data this morning.
Housing
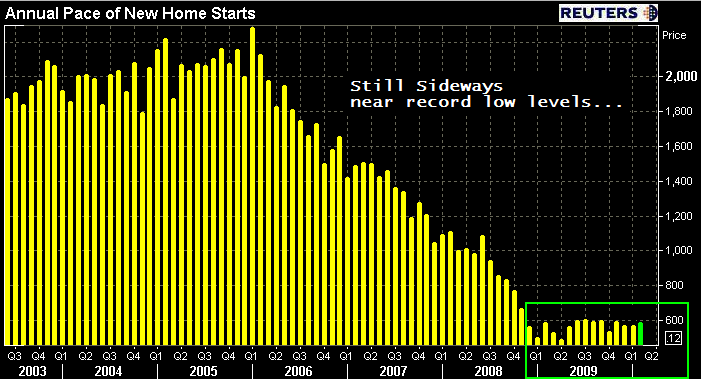
Starts data estimates how much new residential real estate construction
occurred in the previous month. New construction means digging has
begun. Adding rooms or renovating old ones does not count, the builder
must be constructing a new home (can be on old foundation if
re-building). Although the report offers up single family housing, 2-4
unit housing, and 5 unit and above housing data...single family housing
is by far the most important as it accounts for the majority of total
home building.
Building Permits data provides an estimate on the
number of homes planned on being built. The number of permits issued
gauges how much construction activity we can expect to take place in
the future. This data is a part of Conference Board's Index of Leading
Economic Indicators.
In today's release...
BUILDING PERMITS
Consensus Estimate: 620,000 annual units
Result: -4.9% to 621,000
From the release:
Privately-owned housing units authorized by building permits in January were at a seasonally adjusted annual rate of 621,000. This is 4.9 percent below the revised December rate of 653,000, but is 16.9 percent above the January 2009 estimate of 531,000.
Single-family authorizations in January were at a rate of 507,000; this is 0.4 percent above the revised December figure of 505,000. Authorizations of units in building with five units or more were at a rate of 96,000 in January.

HOUSING STARTS
Consensus Estimate: 580,000 annual units
Result:+2.8% to 591,000
From the release:
Privately-owned housing starts in January were at a seasonally adjusted annual rate of 591,000. This is 2.8 percent above the revised December estimate of 575,000 and is 21.1 percent above the January 2009 rate of 488,000.
Single-family housing starts in January were at a rate of 484,000; this is 1.5 percent above the revised December figure of 477,000. The January rate for units in buildings with five units or more was 100,000.
Here is a table summarizing the results, which includes a regional breakdown:
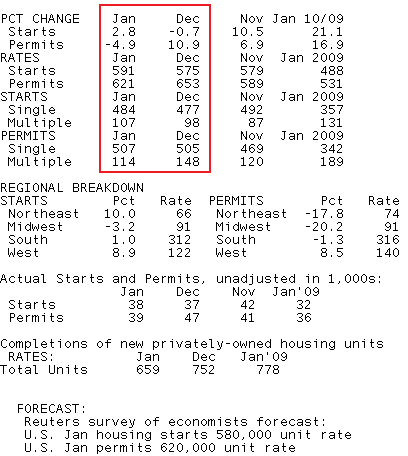
In regards to the month over month data, because Building Permits lead Housing Starts, it was anticipated, after Permits rose and Starts fell last month, that the two metrics would reverse course and correct divergences in January. While this did occur with a little help from the weather, I call attention to the more important indicators, Single-Family Starts and Permits...both increased modestly in January. Check out the table above...weakness was concentrated in multi-family housing permits, not single-family! Unfortunately, while housing is not currently contracting, these month over month marginal improvements (off of record low levels of activity) are not enough to overshadow a general lack of builder confidence.
Last month home builders signaled they were ready and willing to start new construction, but they also informed us they remained hesitant because of economic contraints. That has not changed since last month, if anything there is more rhetoric surfacing about looming negativities. From NAHB Chief Economist David Crowe:
“Builders are just beginning to see the anticipated effects of the home buyer tax credit on consumer demand....Meanwhile, another source of encouragement is the improving employment market, which is key to any sustainable economic or housing recovery. That said, several limiting factors are still weighing down builder expectations, including the large number of foreclosed homes on the market, the lack of available credit for new and existing projects, and inappropriately low appraisals tied to the use of distressed properties as comps.”
We talked about the importance of consumer demand and the labor market extensively yesterday. Here is an excerpt from that post:
The job issue hits home extra hard in housing. Not only do consumers need jobs to qualify for a new mortgage, they need jobs to stay up to date on current mortgage obligations. All appers to be dependent upon EMPLOYMENT! Shadow inventory, consumer demand, and home prices. READ MORE.


