
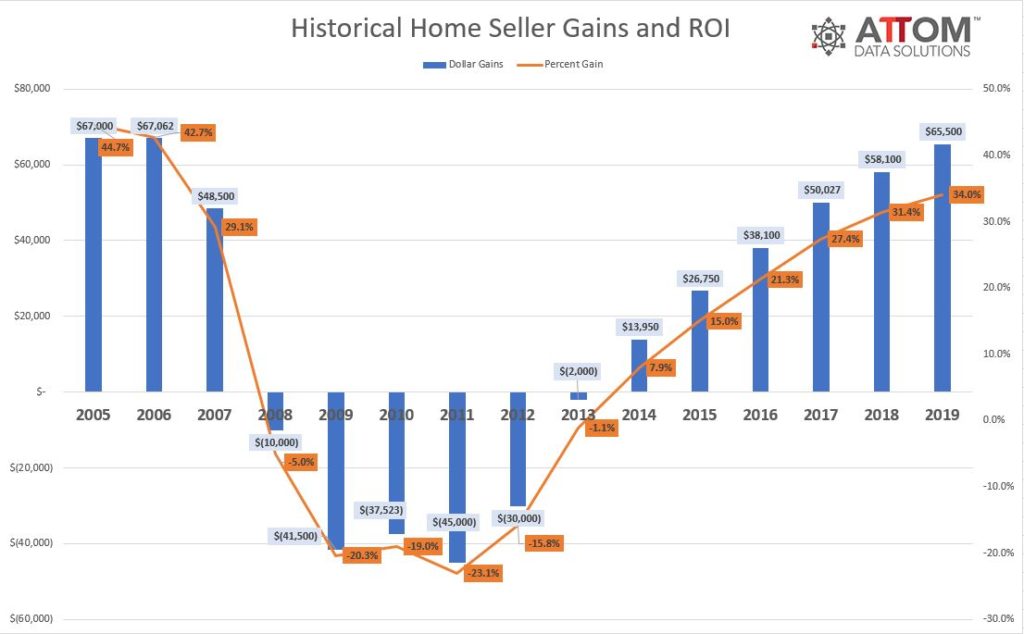
Homeownership is apparently still one of the best ways to build wealth. The Year-End Home Sales Report from ATTOM Data Solutions shows that the typical homeowner who sold a home in 2019 realized a gain of $65,500. This is up from $58,100 in 2018 and $50,027 in 2017 and the largest profit margin since 2006.
Todd Teta, ATTOM's chief product officer said, "The nation's housing boom kept roaring along in 2019 as prices hit a new record, returning ever-higher profits to home sellers, and posing ever-greater challenges for buyers seeking bargains. In short, it was a great year to be a seller.
Profits have increased for eight straight years, and 2019's typical $65,500 profit was a 34 percent return on investment (ROI), the highest in 13 years. Still, the year-over-year gain from the 2018 ROI of 31.4 percent was the smallest since 2011.
Teta remarked that the market seemed to be losing some steam last year as the increases in both profits and profits margins also slowed, reaching the slowest pace since 2011. "While low mortgage rates are propping up prices," he said, "the declining progress suggests some uncertainty going into the 2020 buying season."
Sellers who sold in the fourth quarter of the year had owned their homes an average of 8.21 years, up from 8.08 years in the previous quarter and 7.95 years in the fourth quarter of 2018. The latest figure represented the longest average home seller tenure since the first quarter of 2000, the earliest period in which data is available.
Among 220 metropolitan statistical areas studied, those with the highest returns were on or near the West Coast. Those included San Jose with an ROI of 82.8 percent; San Francisco (72.8 percent); Seattle, (65.6 percent); Merced, California (63.2 percent); and Salem, Oregon (62.1 percent). The first four also topped the list in 2018.
Among some of the other findings in the ATTOM 2019 roundup:
- Nationwide, all-cash buyers accounted for just over a quarter of home sales, the lowest figure since the 18.7 percent share in 2000 and 2007. Cash sales peaked at 38.4 percent in both 2011 and 2012 and accounted for 27.0 percent of sales in 2018.
- The share of distressed sales including short sales, third-party foreclosure auctions, and sales of lender owned real estate (REO) were at a 13-year low, accounting for 11.5 percent of single family and condo sales. Distressed sales accounted for 12.4 percent of 2018 sales and peaked at 38.8 percent in 2011.
- The share of distressed sales increased in eight states and was largest in four states in the Northeast and Mid-Atlantic areas. They accounted for 20.1 percent of sales in New Jersey, 19.5 and 19.4 percent in Connecticut and Delaware respectively, and 18.1 percent in Maryland.
- Institutional investors accounted for the smallest share of buyers since 2015. The share dropped for the third straight year to 2.9 percent in 2019.


