Interest rates take cues from several places. Regularly scheduled economic data is always a consideration because a stronger economy implies more growth and tighter Fed policy, both of which are bad for rates.
Certain reports carry significantly more weight than others. If put to a vote, the perennial top dog would be The Employment Situation (aka "the jobs report"). Over the years it is responsible for more volume and volatility in rates than any other data. The most recent installment came out this morning and it was a doozy.
The headline number of the jobs report is a tally of new job creation reported by employers: nonfarm payrolls (NFP). That's just a fancy name for "jobs." Today's data reported the new jobs added in January, and there were quite a bit more than expected.
NFP can be fairly volatile. It's not uncommon to see the number deviate from forecasts by more than 100k a few times a year. Those big deviations usually result in big reactions in rates. Forecasts called for just shy of 200k jobs. Today's actual NFP number came in at a staggering 517k, thus edging out March 2022 to stand as the biggest deviation since August 2021.
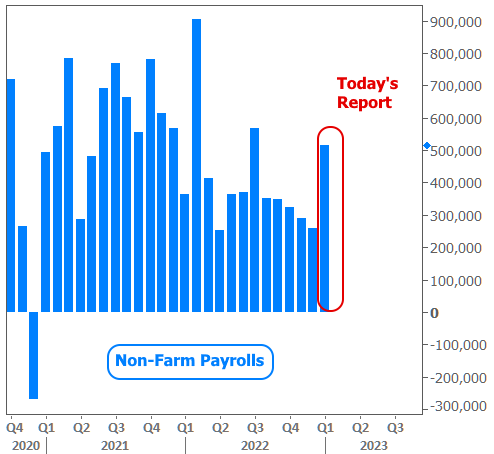
To some extent, the massive gains may be attributed to a seasonal adjustment process that still struggles to understand new seasonal patterns that emerged after the pandemic. But even if we forego seasonal adjustments, the economy added more than 400k jobs per month on average over the past 12 months and the employment rate has fallen to the lowest level since the 1960s.
In other words, despite anecdotes that speak to cracks in the economy, the most highly-regarded measure of employment says things are super strong. Super strong jobs numbers are bad for rates and these were no exception. Fortunately, the damage arrived one day after the lowest rates in more than 4 months. This keeps rate volatility lower in the bigger picture.
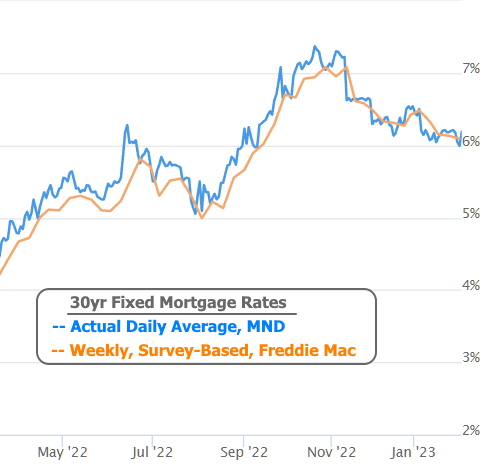
You may notice the small jump at the very end of the blue line in the chart above. That was the impact from the jobs report. Mortgage rates only change once or twice a day at most, so we can examine the week on a more granular level by looking at 10yr Treasury Yields which correlate quite well with mortgage rates.
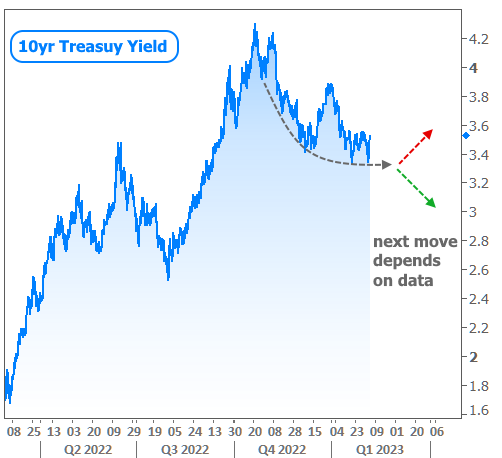
The chart below shows recent movement in 10yr yields both for the US and the EU. Why EU? Because Europe's central bank (the ECB) released a policy announcement this week one day after the Fed released its own policy announcement. Both banks hiked rates as expected, but both delivered comments that the bond market found to be more rate-friendly than expected. That's why US yields fell on Wednesday afternoon after the Fed and EU yields fell on Thursday morning after the ECB.

Despite the volatility in the short term, the bigger picture is much calmer than it had been in late 2022. In fact rates have generally been settling down and shifting into a sideways pattern ever since topping out in the fall. If inflation continues to decelerate and if the economy were to weaken, rates would likely continue lower, but if we see more data like we saw today, that progress would be delayed.
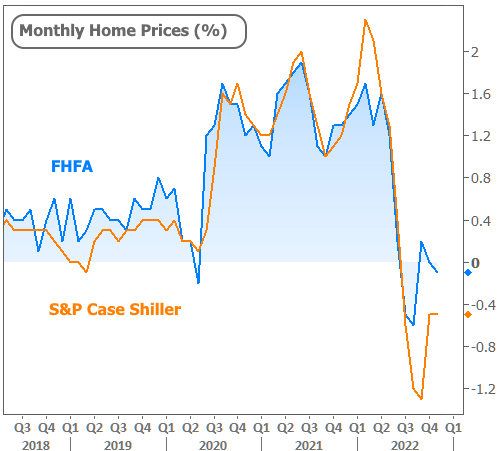
In other news this week, home price indices were updated for both S&P Case Shiller and the FHFA. Prices continue to decline roughly in line with expectations in month over month terms, but remain higher than normal in annual terms.