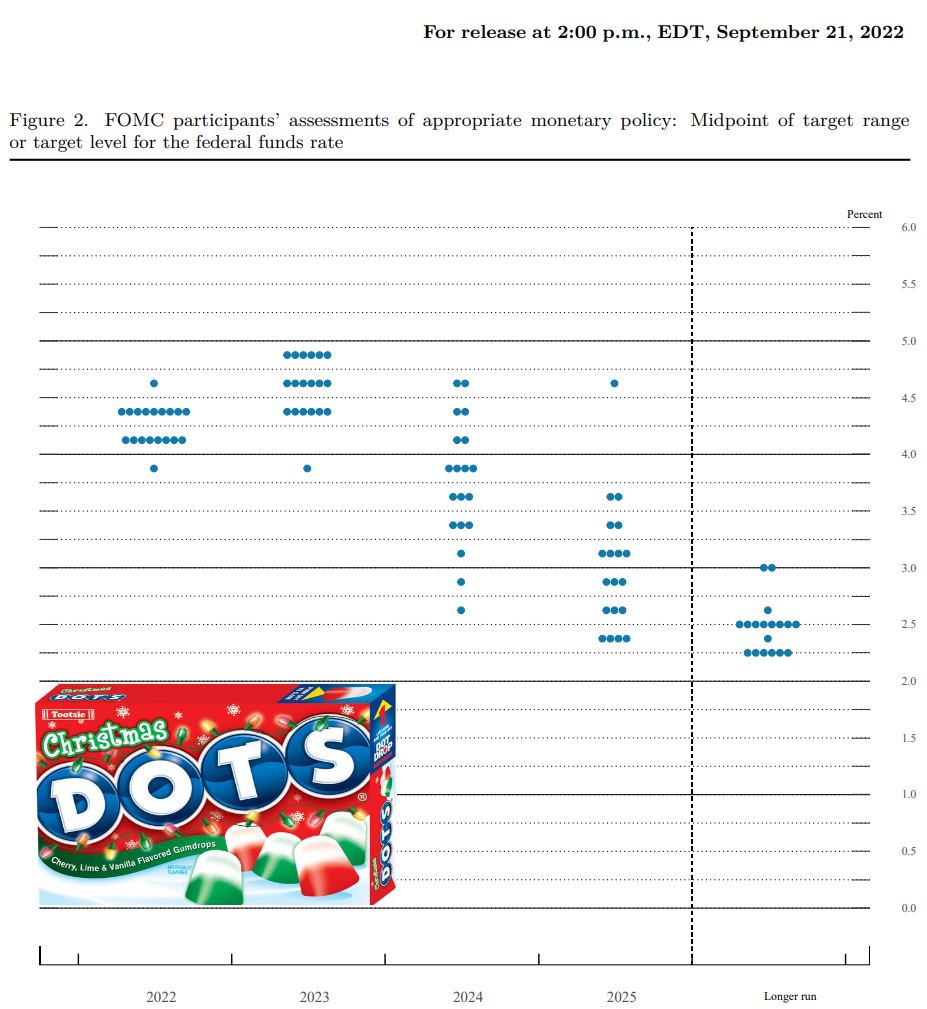
It's Fed day and a 0.50% hike is a foregone conclusion. Markets have fully priced that in and multiple Fed speeches--including Powell 2 weeks ago--have all but confirmed that Fed is unanimously onboard with a smaller hike at today's meeting. The other thing we heard in those recent speeches--including Powell 2 weeks ago--is that we should expect an upgrade to the dots (the summary of economic projections that includes Fed members' individual rate hike outlook). The market doesn't value the dots as a highly accurate prediction tool, but the window into the Fed's line of thinking has consistently been a highly tradeable event on the 4 times per year that we get the update. Today's dot plot remains highly interesting and uncertain due to the proximity of the CPI data and the fact that Fed members submitted their forecasts on Friday, but have the option to revise them after yesterday's CPI.
So how may the dots change? In addition to the holiday theme seen in the following chart (ok, we may have added something there), the Fed speeches from before the most recent CPI suggest that the 2023 dots should be higher with a median moving up from 4.75 to perhaps 5.0. From there, we have to wonder if yesterday's CPI would have prompted any of the dot plotters to revise their dot thoughts. Word on the street is that the forecasts are submitted Friday but can be revised through the FOMC meeting (which began yesterday and ends today). As such, we remain a bit hesitant to assume these dots fully capture any shift due to CPI. Fed members are human beings, and not all of them may think it's critically important (or even warranted) to make a small adjustment to their already-submitted dot due to one friendly inflation report.
In other news, I received a question about the comparisons between mortgage rates and the Fed Funds Rate. There are several ways to approach this topic, but in general, all interest rates tend to trend together over long periods of time. In other words, blur your eyes, zoom the chart out, take a few steps back from the monitor, and the Fed Funds Rate looks like mortgage rates over the past few decades. But closer inspection shows major divergences that last plenty long enough to make a big difference for loan originators and mortgage consumers.

We see more correlation between the Fed Funds rate and other rates when we're using Fed Funds rate EXPECTATIONS rather than the rate itself. One of the most obvious reasons for this is that expectations can trade essentially all the time whereas the Fed Funds rate will only be updated 8 times a year barring emergencies. Still, even in this chart we can see longer term rates breaking away (lower) from the Fed Funds expectations. This is the typical pattern at the top of a rate hike cycle. The next part of the pattern involves longer term rates slowing their decent while Fed Funds fall faster.

The rate announcement, statement, and dot plot come out at 2pm ET. Powell's press conference begins at 2:30pm ET.


