Another day, another false start confirmed for the stock market. More specifically, the modest bounce in stocks that was intact on Tuesday afternoon has been erased. Overnight trading brought averages even lower with a circuit breaker stopping the action just after 8am ET. S&P futures are now in the mid 2500's after being above 2800 early yesterday morning.
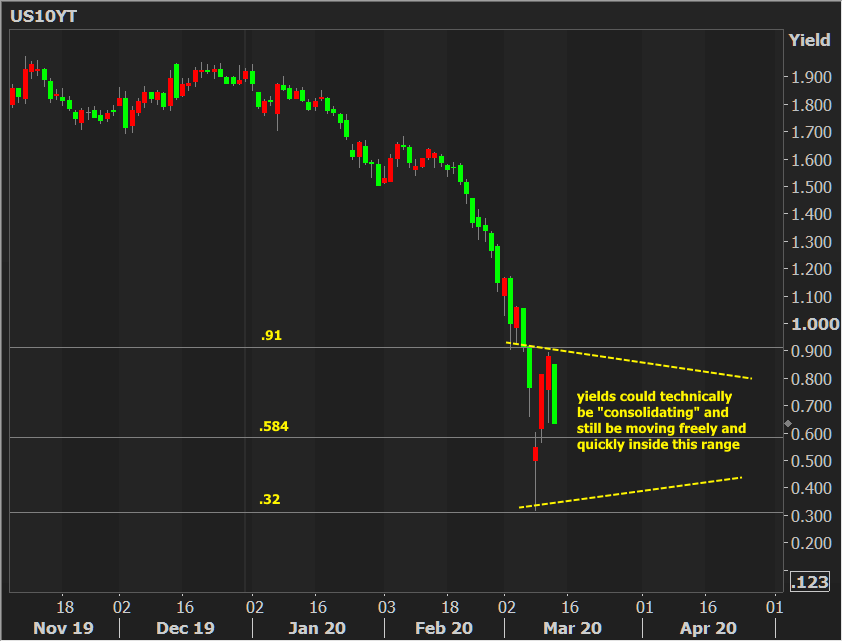
For Treasuries, this week's bounce hasn't been quite as easy to erase, but at the very least, it seems to be finding a ceiling. If these volatile back-and-forth trading days are like the past examples that follow a massive rally, we could be settling in for significant volatility inside a well-defined range. It's too soon to tell if it would be a sideways/consolidating range, or a sloped "trend channel," but the most neutral hypothetical path is highlighted in the first chart below.
Even in such a neutral scenario, the speed with which yields could move inside such a range would be staggering (and it would continue to cause problems for MBS). What do MBS problems look like? Here's a chart of MBS yield vs 10yr Treasury yield in the shorter term (higher is weaker):

And in the longer term:
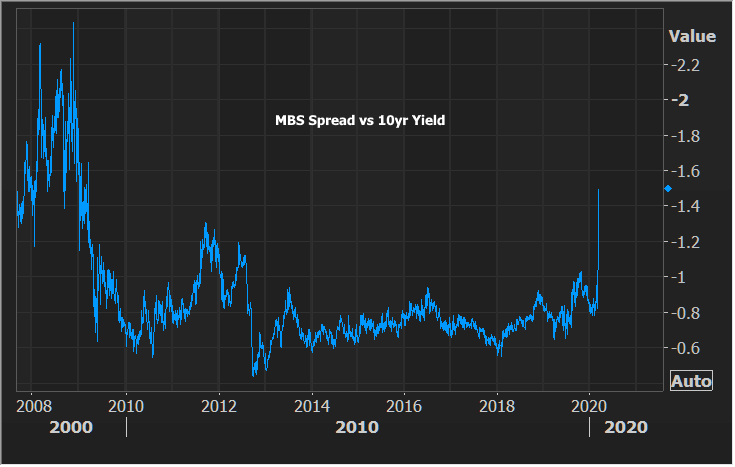
If that looks like a big deal, it is. MBS are in a world of pain, and just as much pain exists in spreads seen between mortgage rates and MBS. Only time and stability will allow this to heal.
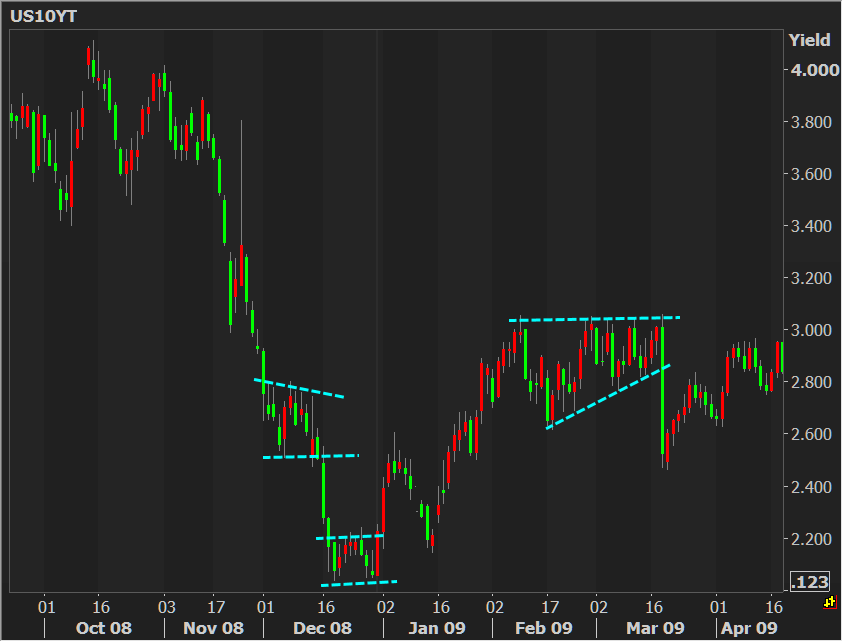
On a final note, here is the promised past precedent for sideways volatility in Treasuries after big moves. Some are bigger than others. Some are sideways/consolidating. Some are trend channels that ascend or descend. But in all cases, big, directional moves in bonds gave way to periods of well-defined ranges for weeks at a time before the market finally figured out where it was going.