
According to CoreLogic, it doesn't matter whether you rent or recently bought a home, your housing costs probably went up over the last year. Two separate posts in the CoreLogic Insights blog look at the rising costs, and find that homeowners are being hit harder than before. Still, when viewed historically, the cost of owning remains more affordable.
There has been a steady increase in rents since 2010. Many households vacated homeownership, voluntarily or otherwise, and others that in better times would have bought rented instead. Those increases hit an annual peak, as measured by the CoreLogic Single-Family Rental Index (SFRI), of 4.4 percent in February 2016.

Analyst Shu Chen writes that, since then, the increases have declerated slowly. In August's most recent data, the index, which uses a repeat-rent analysis to measure the same single-family and condo rentals, was up 3.0 percent year-over-year.
Overall rent growth was pulled down by the high-end rental market, defined as properties with rents 125 percent or more of a region's median. Those rents increased 2.3 percent year over year in August, compared to a gain of 2.5 percent a year earlier. Meanwhile, rents in the low-end market, properties with rents less than 75 percent of the regional median rent, increased 4.4 percent year over year in August 2017, one percentage point lower than the August 2016 rate.
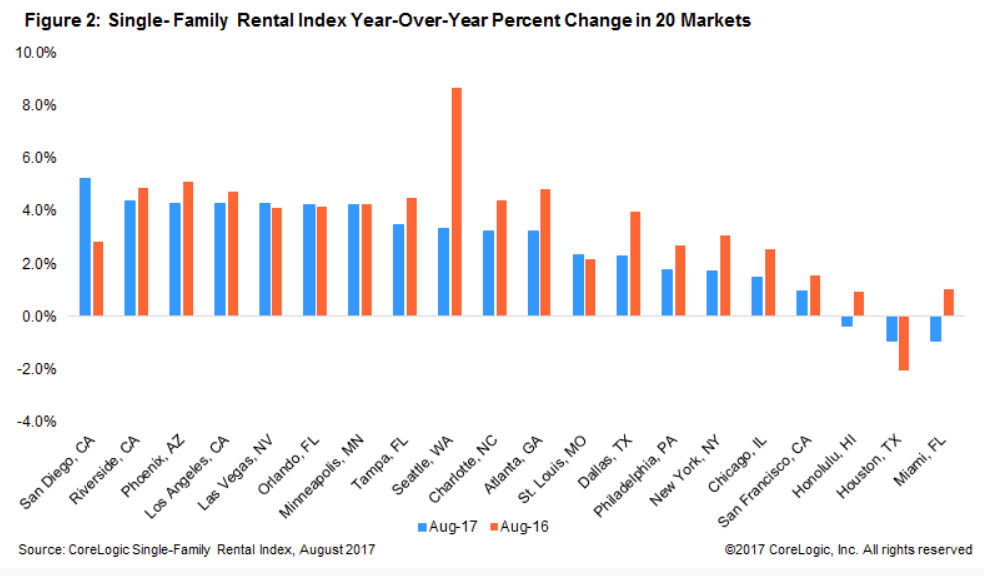
Rents are, of course, geographically variable. Most of the 20 largest core-based statistical areas had rent increases, but those with limited new construction and strong local economies tend to have low rental vacancy rates and stronger rent growth. The largest rate of growth was in San Diego, while Phoenix experienced 4.3 percent year-over-year rent growth, driven by employment growth more than double the national growth at 2.8 percent year over year. In contrast, Houston, which has been hit with energy-related job losses since early 2015, saw rents decline by 0.9 percent year-over-year (pre-hurricane) and Miami was also down. Seattle's skyrocketing rents, and rents in other cities that experienced strong but less exuberant gains, saw growth moderating significantly.
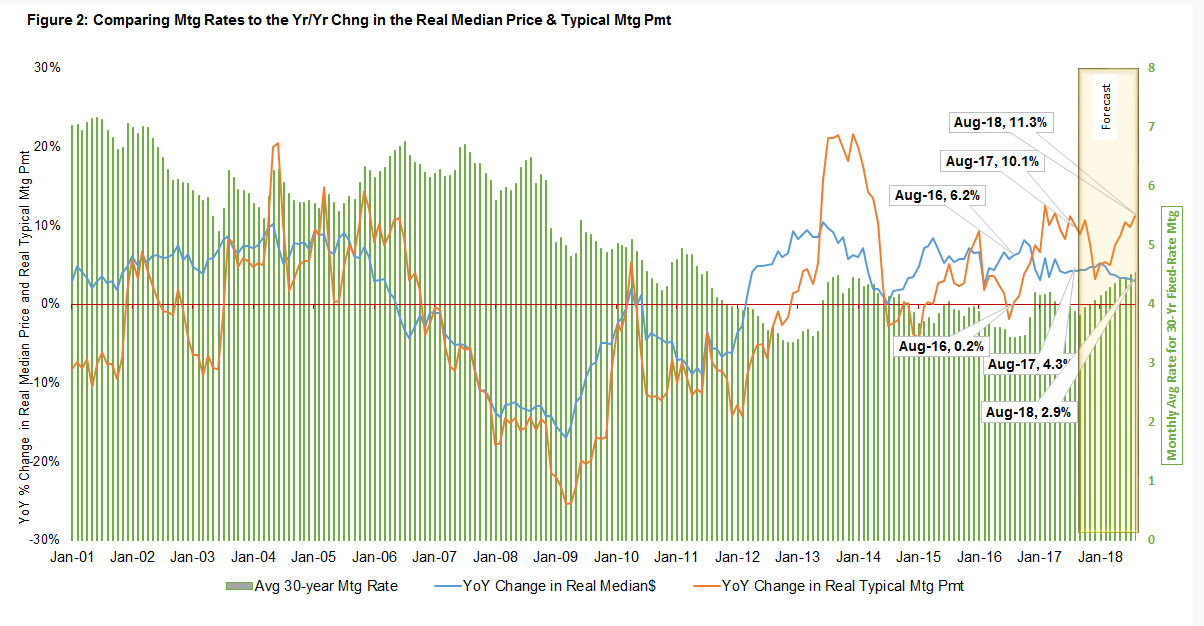
But at first glance, renters are getting off easy when compared to those shopping for new homes and loans. Andrew LePage says that while home prices have risen about 6 percent over the past year, recent homebuyers have taken on mortgage payments that have risen closer to 10 percent.
He looked at the "typical mortgage payment", a monthly payment based on each month's U.S. median home sale price using Freddie Mac's average rate on a 30-year fixed-rate mortgage with a 20 percent down payment. The measure does not include taxes or insurance. The result, LePage says, is a good proxy for affordability because it shows the monthly amount for which a borrower would have to qualify to purchase a median-priced U.S. home. When adjusted for inflation, the typical mortgage payment also puts current payments in the proper historical context.
It can be misleading, the author says, to simply focus on the rise in home prices when assessing affordability. For example, the median home price in August was up 6.3 percent year-over-year in nominal terms, but, because mortgage rates had increased nearly 50 basis points over that period, the typical payment was 10.1 percent higher.
To illustrate the importance of including more than just home prices in affordability discussions, Figure 1 shows that even as the inflation-adjusted typical mortgage payment has trended higher in recent years, as of August it was still 34.7 percent below the all-time high payment of $1,250 in June 2006. That's because the average mortgage rate back in June 2006 was about 6.7 percent, compared with 3.9 percent this August, and the inflation-adjusted median sale price in June 2006 was $242,723 (or $199,900 in 2006 dollars), compared with a median of $216,811 in August 2017.
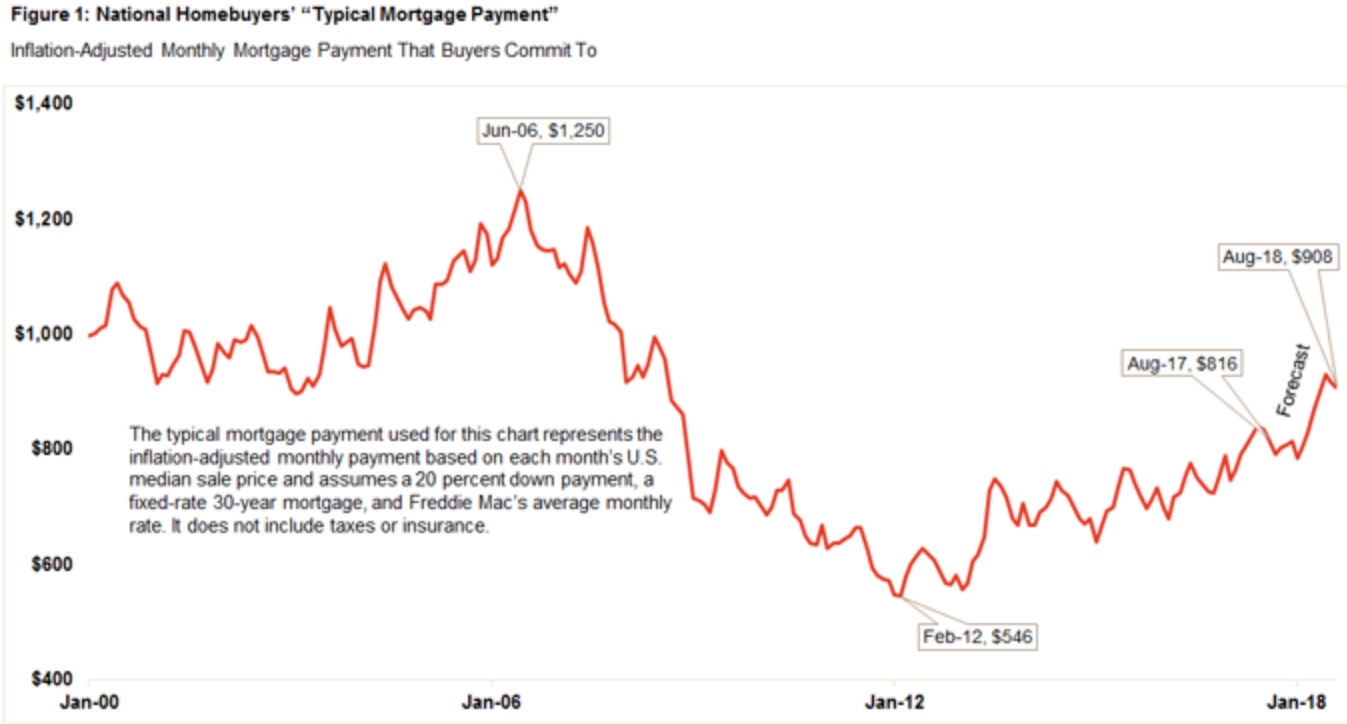
There are forecasts (IHS Markit) for inflation and income to rise gradually over the next year, while the consensus of forecasts from various sources such as the GSEs, Realtors, and others, suggest mortgages rates will be 70 basis points higher by August of next year. CoreLogic's forward-looking Home Price Index suggests a 3.0 percent in real terms over the same period. "Based on these projections," LePage says, "the inflation-adjusted typical mortgage payment would rise from $816 this August to $908 by August 2018, an 11.3 percent year-over-year gain. Real disposable income is projected to rise about 3.6 percent over the same period, meaning next year's homebuyers would see a larger chunk of their incomes devoted to mortgage payments."
"While I can appreciate CoreLogic is trying to shed light on actual increases in payments vs prices, I'd like to see a bit more light before jumping into the rabbit hole of who has it easier between owners and renters," says Mortgage News Daily's Matt Graham. "Notably absent from this analysis is any mention of the benefits that owners realize from appreciation and tax deductibility (of both mortgage interest and property taxes). True, the latter is up for debate in new tax reform efforts, but current drafts would leave meaningful benefits for homeowners in place. Even without the tax benefit, home price appreciation (not to mention payment predictability) makes the issue far from black and white."


