
A change in conforming loan limits could have a big impact on mortgage originations and on homebuying in general according to Black Knight Financial Services. The company did an analysis of those limits in its current edition of the Mortgage Monitor which covers mortgage performance data from September.
Black Knight says with the national HPI returning to pre-crisis levels talk has now turned to raising those levels. The current conforming limit, $417,000, has not changed since 2006. The Housing and Economic Recovery Act (HERA) of 2008 restricted any additional increase in the limit until national home values had returned to pre-crash levels.
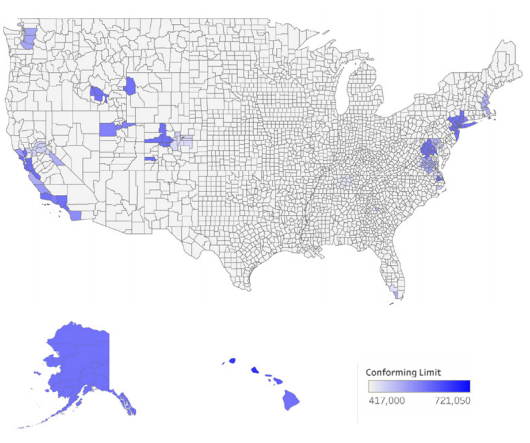
There are currently 234 designated "high cost" counties (indicated on the map) where conforming limits exceed the national level, going as high as $721,050 in Honolulu. Despite the small land area covered by these counties, they account for over 30 percent of mortgage originations, and 60 percent of jumbo mortgages.
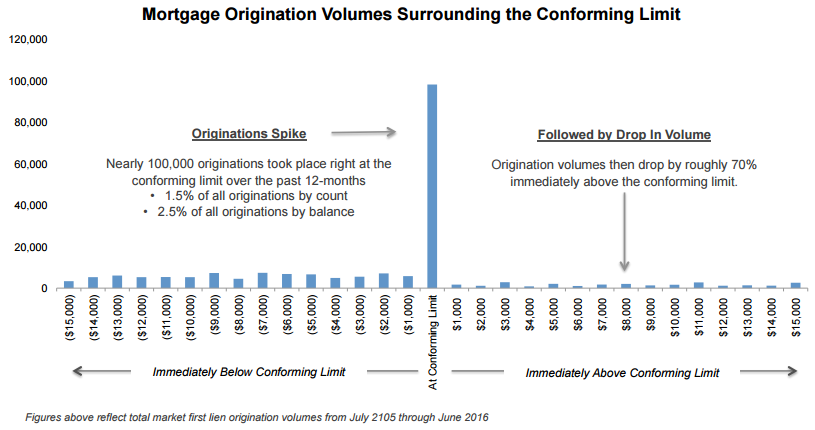
Black Knight says its analysis shows there are approximately 17 times as many originations, about 100,000 over the last 12 months, right at the conforming limit compared to preceding dollar amount buckets. Then originations plummet by about 70 percent immediately past the limit.
The primary source of lending for borrowers above the conforming limit is privately held jumbo mortgages which typically carry more stringent underwriting guidelines than conforming loans. Consequently, many borrowers who may not qualify for jumbo loans must either bring extra cash to closing or take out a piggy-back second loan to keep their borrowing within the limits.
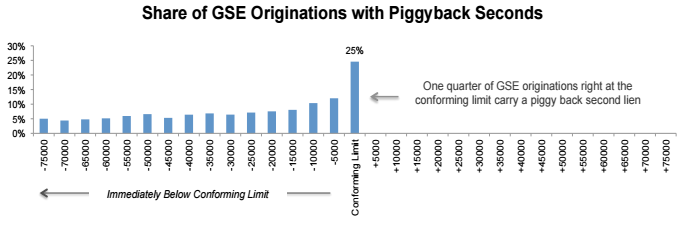
The data shows that a GSE loan originated right at the conforming limit is nine times more likely to carry a second lien than one that is not. The share of originations with second liens begins to rise at around $15,000 before the limit and spike right at the edge. One quarter of originations made at that point since 2012 have carried piggyback seconds.
Combined loan-to-value (CLTV) ratios are also lower right at the cusp of the limit even as second liens increase, indicating that many borrowers are bringing money to the table to stay within bounds.
All of this, Black Knight says, shows there is a clear demand for an increase in conforming loan limits. One scenario shows that, with all else being equal, raising the limit by $10,000 could result in a one percent increase in originations -- approximately 40,000 new loans and $20 billion in new loan balances." Rather than the current 70 percent drop-off after the old limit, they estimate volumes will carry forward based on the average originations per $1,000 immediately prior to the current limit.
Applying the GSEs' approximate 50 percent market coverage immediately prior to the existing limit there would be roughly 28,000 new GSE originations per year, or a $14 billion increase in loan balances. The company cautions that this scenario assumes similar origination rates as in the prior 12 months which is unlikely in the face of rising interest rates.

Over half of all loans originated right at the conforming limit were in five states, California, Texas, Florida, Illinois, and Georgia. It is likely the largest impact of high limits would be in the first two although 80 percent of the loans in California were in designated high-cost areas
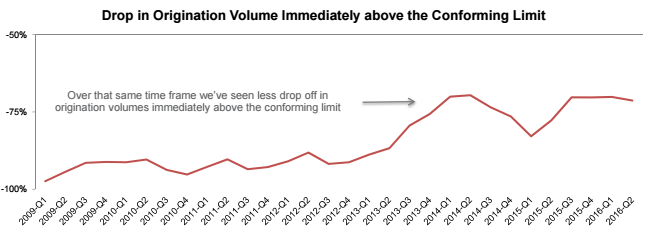
Black Knight says the existing limits may have less of an impact today than they once did. Jumbo loans traditionally carried a higher interest rate than conforming loans but that has not been the case for the last three years; they have generally been lower. During that same period Black Knight says it has observed a bit less of a drop-off in overall origination volume immediately above the conforming limit that in previous years. Interest rates, economics, and jumbo credit availability may be contributing to this change, however weighted average credit scores for jumbo originations don't indicate there has been notable credit loosening in that market.
There have been, as of September, 52 consecutive months of annual home price appreciation (HPA) so the Monitor took a closer look at HPA trends and home affordability. As Black Knight Data & Analytics Executive Vice President Ben Graboske explained, those two topics are closely intertwined with the issue of raising loan limits.
"The latest Black Knight Home Price Index (HPI) report showed that, as of the end of August, U.S. home prices were within just 0.7 percent of hitting a new peak," he said. "This is important for a number of reasons, not least of which is the impact it could have on home affordability."
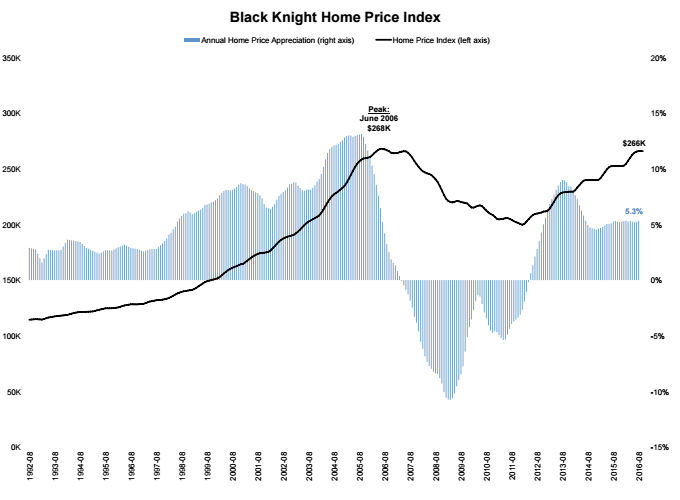
The national level HPI level is now $266,000 and the annual HPA in August was 5.3 percent and has been relatively stable in that range over the last 12 months. This is above the average 1992-1996 average of 2.8 percent but well below what happened during the bubble. Housing supply remains extremely low, with only a 4.6-month supply in August.
Starting in 2012, condo prices began rising faster than single family (SFR) prices but that is no longer the case. They have been decelerating for the past 12 months and how have an HPA of 4.7 percent, more than 50 basis points lower than for SFR units.
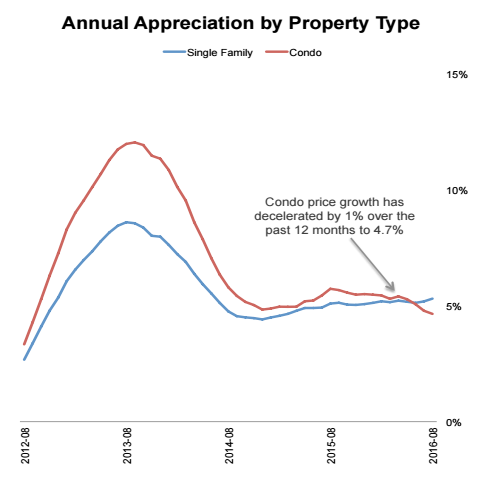
Condo prices still outpace SFR prices in the three fastest appreciating states, Oregon, Washington, and Colorado, but in the remainder of the top ten there is a different story. The condo HPA in Florida is roughly half that of SFR and 40 percent below in Nevada and Michigan.
Despite seeing higher levels of HPA since 2012, condominiums are still 9 percent below the 2006 peak while SFR prices are 1 percent above.
Affordability however, remains steady. Graboske says low interest rates continue to offset rising home prices. "In fact, even though the value of the average home in the U.S. increased by about $13,500 over the last year, thanks to declining interest rates it actually costs almost exactly the same in principal and interest each month to purchase as it did this time last year. Even taking into account the fact that affordability can vary -- sometimes significantly -- across the country based upon the different rates of HPA we're seeing, that's a pretty incredible balancing act between interest rates and home prices at the national level.
"Of course, if and when rates rise, that will change. Right now, it takes 20 percent of the median monthly income to cover monthly payments on the median-priced home, which is well below historical norms. A 50 basis point increase in interest rates would be equivalent to a $17,000 jump in the average home price, and bring that ratio to 21.5 percent. This increase is still below historical norms, but puts more pressure on homebuyers."
In some states home price growth has washed out the benefits of recent interest rate declines. The map below shows the change in the monthly P&I payments required to purchase the median home over the last 12 months. State level income is not taken into account in this graphic.

Black Knight notes that, as interest rates rise, even more affordability pressures will be felt on markets within these states.


