
By mid-October the average interest rate for 30-year fixed rate mortgages (which at that point was at 4.85 percent) represented an increase of 85 basis points from the first of the year and 35 basis points just since August. In light of this, Black Knight's September Mortgage Monitor attempts to measure how many homeowners might still have an incentive to refinance their homes. They estimate that the refinanceable population has been more than cut in half (a 56 percent reduction) since the beginning of 2018 as some 2.2 million people have lost that incentive. This leaves only about 1.86 million homeowners who would be likely to qualify for refinancing and still have a rate-based reason to do so.
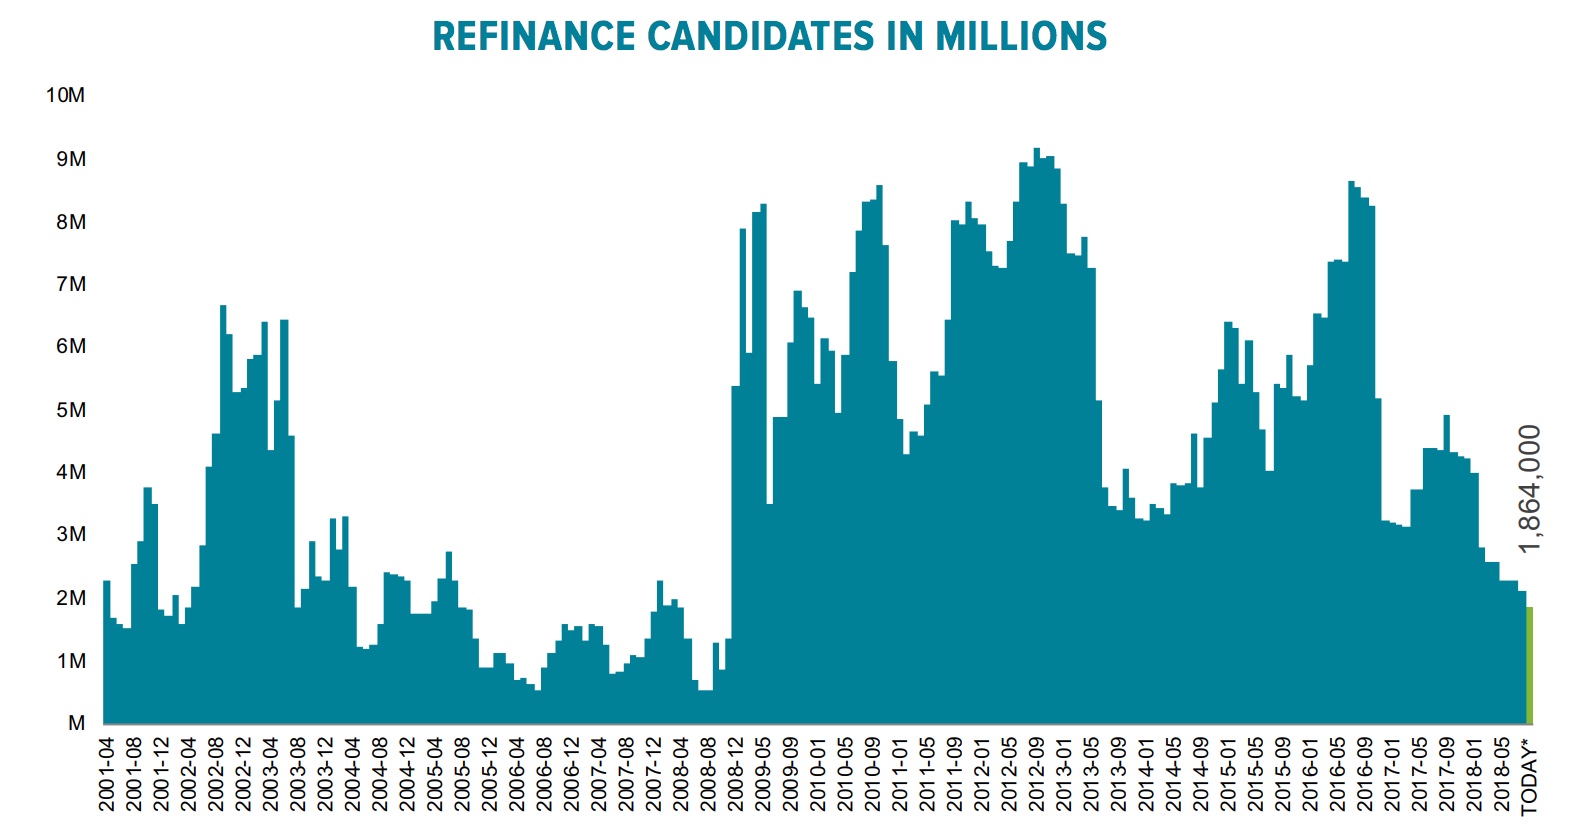
Black Knight defines the incentive as a transaction that would provide borrowers with at least a 0.75 percent reduction in their rate. The recent reduction in the refinance pool in only the latest in a recent string; 5.9 million have lost an incentive since 2016 and 6.5 million since 2009. The current pool of likely refinancers is the smallest since 2008.
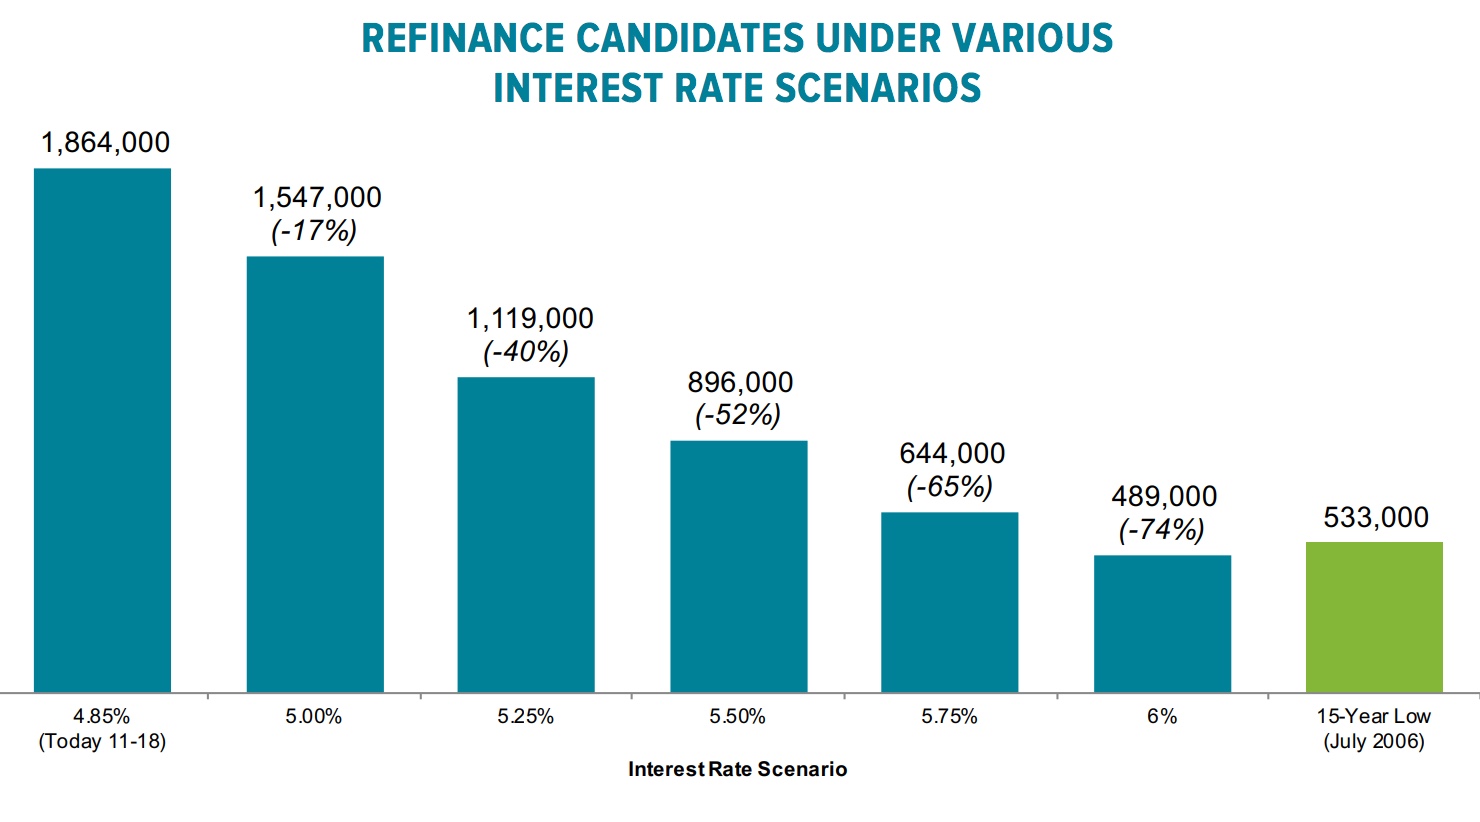
The Monitor analyzed the probable pool going forward under various interest rate scenarios. Should rates rise to 5.5 percent it could cut it in half again, leaving fewer than 900,000 candidates remaining. At 6.0 percent the pool would drop to a 15-year low.
This dire scenario however is likely to be offset by some increase in cash-out refinancing which has been rising off of post-recession lows. At present those refinances, usually defined as a mortgage that is at least 5 percent larger than the one it is replacing, are currently accounting for nearly four out of five refinance transactions. A 14 percent increase in those refinances would fully offset a 50 percent decline in rate/term refinances. This, the Monitor says, means that market is closer to the bottom than the refinanceable population would suggest.
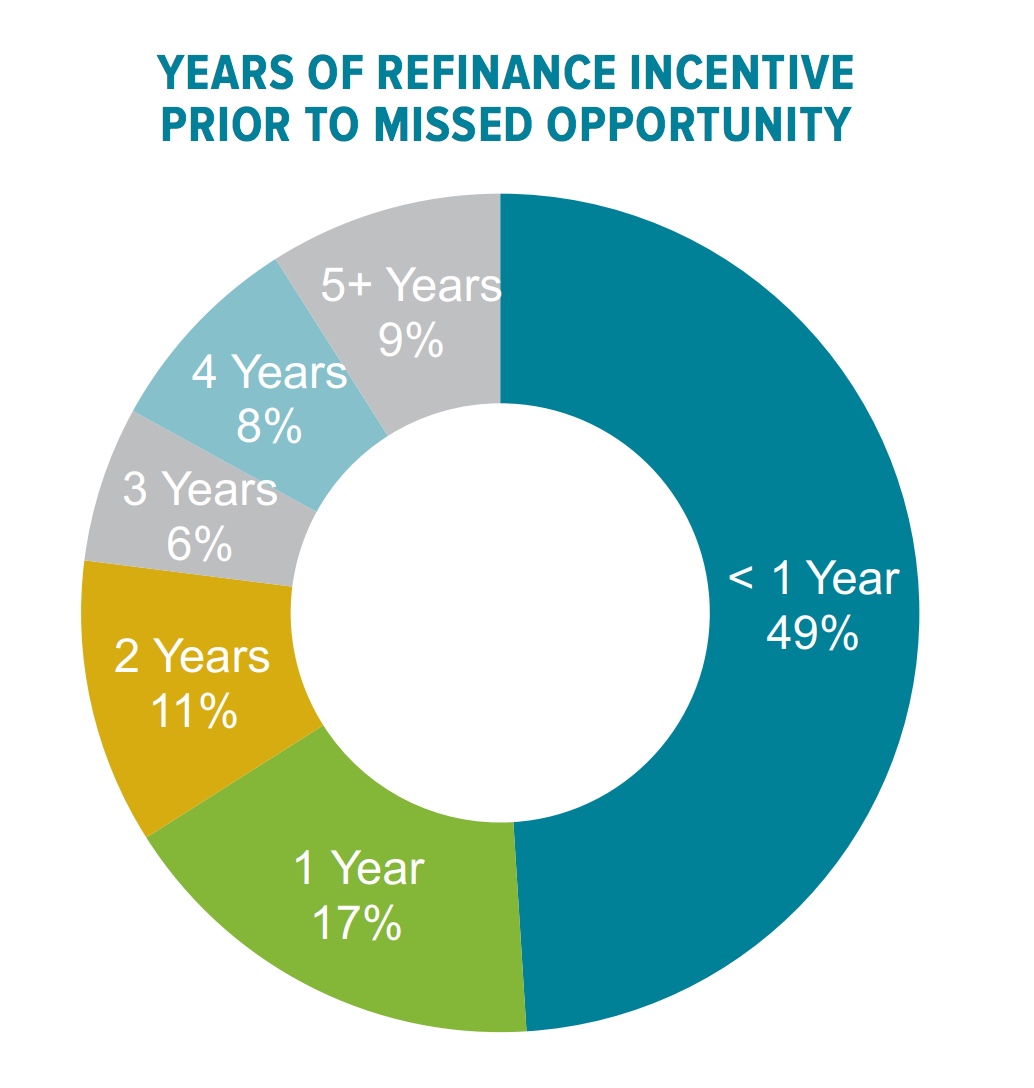
Just in case the estimated 6.5 million homeowners who missed out on refinancing wonder what they lost, the Monitor has the numbers, although it concedes that most didn't really have all that much time in which they might have acted. Using the benchmark of seeing at least an 0.75 percent reduction, about 3.2 of that 6.5 million had the incentive for less than 12 months and another 1.1 million for 12 to 23 months. The remaining 34 percent (2.2 million) could have profitably refinanced for more than two years and 560,000 for five years. The average borrower had a 22-month window in which to refinance and would have saved an average of $228 per month or an aggregate of $1.5 billion per month.
Most of those borrowers who missed the window of opportunity took out their mortgages after 2009 and so had interest rates that were slipping or had already slipped into record low rate territory. Forty percent took out their loans from 2009 to 2011. The majority remaining in the refinance pool are those with the necessary equity and credit quality but still remain in pre-recession loans.
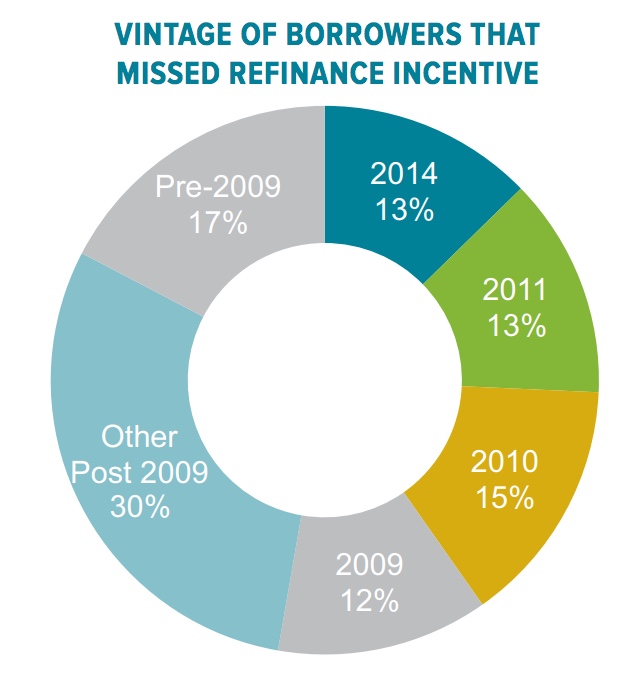
Most of the decline in refinance incentive has come since 2016; 2.3 million borrowers lost their incentive in that year alone. Another 1.4 million did so in 2017 along with 2.2 million so far this year. Those borrowers who might have refinanced but did not tend to carry lower-balance loans, an average of $156,000, about 42,000 below the industry average.

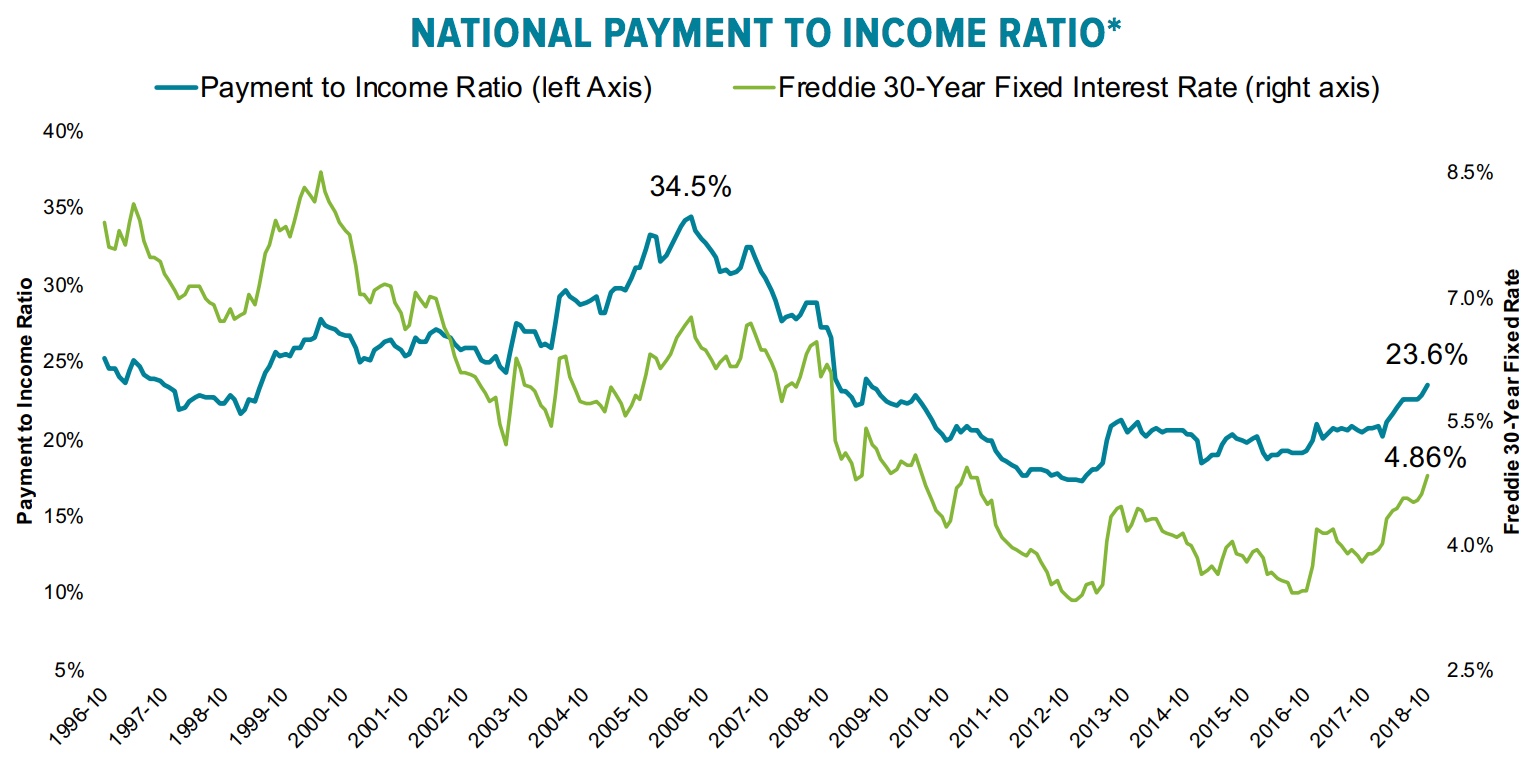
Black Knight also attempts to quantify the impact of rising interest rates on home affordability and finds that the monthly principal interest payment on an average home has gone up by 18 percent so far this year or $190 per month. It now takes 23.6 percent of a monthly income to make that monthly payment, making housing the least affordable in a decade. Housing however still remains more affordable on average nationwide than during the long-term benchmark of 25.1 percent from 1995 to 2003. That number is fragile; another 50 basis point increase in interest rate, even in the face of flat home prices, would push affordability to a new low.
California is the least affordable state; 39 percent of the median income is required to purchase the average home in the state. Surprisingly the second least affordable state is Maine, at 33 percent. The most affordable areas of the county remain in the upper Midwest. Ohio and Indiana are the least expensive states at 13 and 14 percent respectively and Nebraska is the only state in that region to cross the 20 percent line. Rising interest rates are starting to push affordability down in that region as well.
At the start of the year only California and Hawaii had home ownership ratios higher than their 1995-2003 benchmarks. In California it is up 7.5 percent, 8.0 percent in Hawaii. But by September a total of 10 states had passed their benchmarks and another six were within 1.0 percent.
Some cracks are beginning to show. Home price growth in Hawaii has slowed from 4.5 percent in February to 3.0 percent in August and California has followed suit. The rate of appreciation there has fallen from 10.2 to 6.8 percent over the last six months. The average home in California has dropped in value for three consecutive months and is down 1.3 percent (a decline of $7,200). This is the first quarterly loss since the recovery began in 2012.
Ben Graboske, executive vice president of Black Knight's Data & Analytics division said prices are softening nationally as well. "Prices were up just 0.05 percent in August, roughly one-third of the 25-year average for the month, and early indicators point to a slight decline in September. That would be the first pullback in home prices in 21 months and only the second since 2015. As rates were relatively flat from June through August, this represents a continued reaction to the tightening affordability that took place early in 2018, and not the most recent jump in rates. We'll be watching the data closely to see whether this second wave of interest rate rises enhances the slowdown we're currently seeing in home price growth across the country."
The Monitor also looked at the national inventory of active loans in foreclosure. The September data shows that this inventory has fallen to pre-recession averages for the first time since the financial crisis. Graboske said, "The improvement is actually even more impressive than it may seem. Taking into account today's foreclosure rate and the fact that there are 16 percent more active mortgages today than the 2000-2005 average, relatively speaking, foreclosure inventory is actually 40,800 below pre-recession "norms." At the current rate of reduction (a six-month average annual decline of 27 percent) active foreclosure inventory would hit a record low in September 2019, with fewer than 200,000 cases nationwide."


