
The amount of equity available for tapping by homeowners hit a new recent high in February. Meanwhile, mortgage prepayment rates (how quickly owners are refinancing or selling) fell to the lowest levels since early 2014. Black Knight's Mortgage Monitor, which focuses on details of mortgage performance during the months, looked at these two aspects of that performance as well as updating hurricane related delinquencies four and five months after Harvey and Irma wreaked havoc in Texas and Florida.
Loan prepayments or the SMM (Single Month Mortality) rate hit a four-year low during the month. In fact, only three months over the last 15 years have had a lower rate of paydowns and payoffs, September and November 2008, just as the housing downturn was reaching crisis levels, and February 2014, a period with interest rates and a seasonal environment similar to this past February.
This time it was a spike in interest rates that served to reduce the SMM. Prepayments are strongly correlated with refinancing rates, and in the first two months of the year the number of potential refinancing candidates has declined by more than 40 percent. The refinanceable pool, the term used by Black Knight to describe the number of homeowners with both the incentive and the ability to refinance is now the smallest since late 2008 and, the company says, it is no surprise that prepayments are among the lowest since that time period as well.
Adding to rising rates is the seasonal factor; February is also near the year's trough for home purchases, cutting down on the number of prepays related to housing turnover.
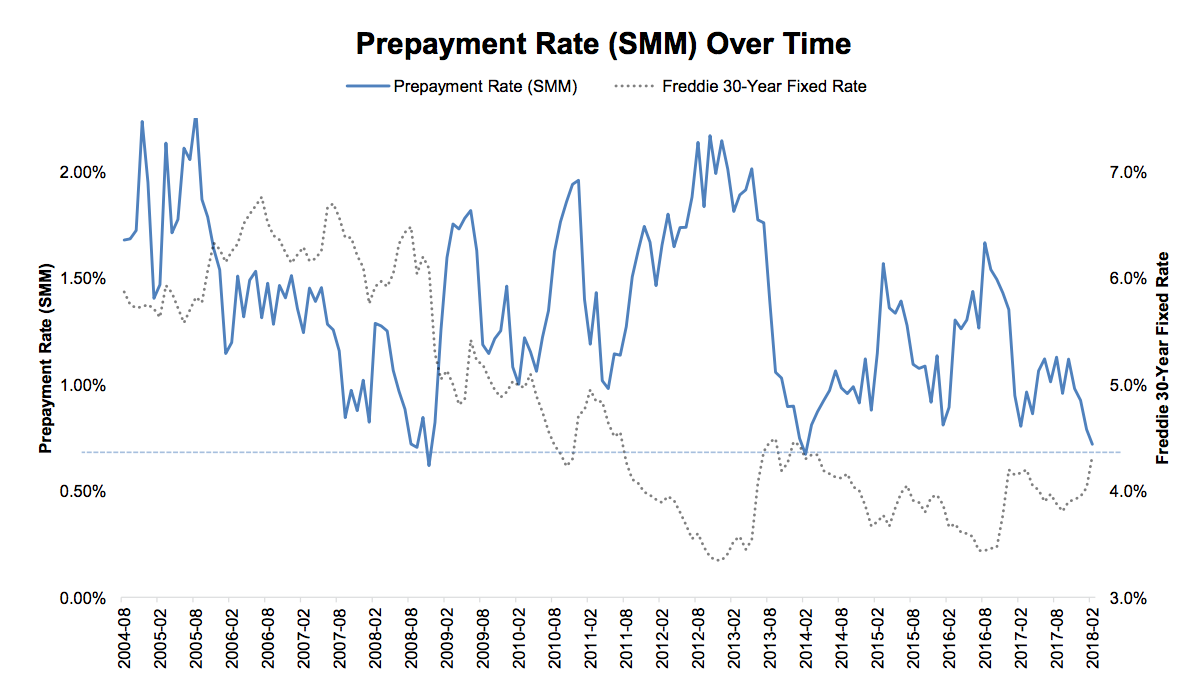
Borrowers with credit scores between 620 and 719 are currently prepaying their mortgages at the highest rate, while those with scores above 720 are the lowest, slipping even below those with scores under 620 which have had the lowest rates for 97 of the last 98 months. It is only the second time in more than 9 years that the 720+ borrowers have been at the bottom. The single most important driver of prepays in the under 620 score cohort is and has long been loan default
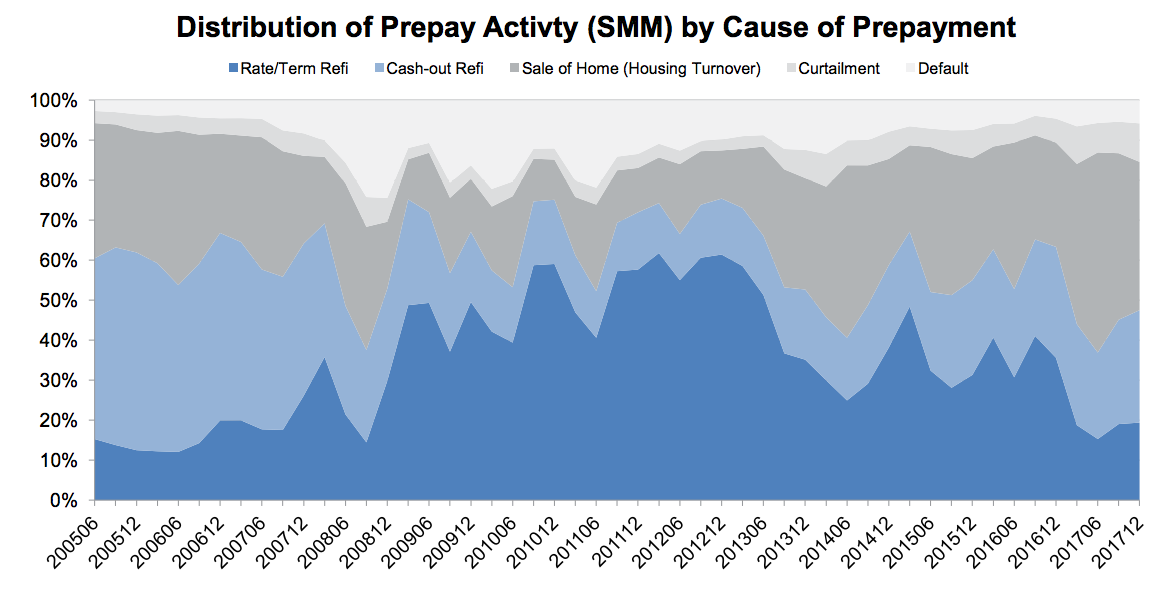
Black Knight says by matching their data with public records they can demonstrate there are significant shifts not only in prepayment activity but what drives that activity over time. During 2017 housing turnover accounted for an average of 47 percent of prepayment activity each quarter, up from 29 percent in 2016. In Q2 of 2017 it made up half, the largest such share since Black Knight started tracking it in 2005. The company says that, given the rise in rates and the subsequent decline in the refinance pool, it is likely that home sale activity will account for more than 50 percent of prepays again in mid-2018. Cash-out refinances now accounts for more prepayments than rate-term refinances, 28 percent of all SMM. The company says that, as home sales become the primary driver of prepayment activity, seasonality will become more important to SMM and that rate will experience more fluctuations.
The amount of equity available for homeowners to tap is now the highest on record in terms of dollars, $5.4 trillion. This is 10 percent higher than the prior peak reached in 2005, but the practical availability of this money as a tappable resource is mitigated by the fact that 75 percent of it is held by borrowers with existing interest rates below the current prevailing 30-year rate.
As Black Knight Data & Analytics Executive Vice President Ben Graboske said, "Tappable equity rose by $735 billion over the course of 2017, the largest dollar-value calendar year increase on record. Still, Americans seem more reserved in tapping their equity than in years past, withdrawing less than 1.25 percent of all tappable equity in Q4 2017 - a four-year low. Of that total, 55 percent was tapped via HELOCs, the lowest such share we've seen since the housing recovery began. However, as interest rates rise, it is likely that we will see the HELOC share of equity withdrawals increase as well.
"At the start of 2018, some 55 percent of all tappable equity was held by borrowers with first-lien interest rates below the going 30-year rate. Following the nearly 50 basis points rise in interest rates we've seen since the start of the year, that share has ballooned to 75 percent. While rising rates tend to dampen utilization of equity in general, the market is poised for a strong shift toward HELOC utilization, as they allow borrowers to take advantage of growing equity while holding on to historically low first-lien interest rates. Sixty-five percent of total tappable equity - approximately $2.8 trillion - is held by borrowers with credit scores of 760 or higher and first-lien interest rates below today's prevailing rate, which creates a large pocket of low-risk HELOC candidates."
Recent cash-out refinances have also displayed a relatively low level of risk, with an average credit score of 744 for borrowers taking out those refinances in 2017. Borrowers pulled an average of $68,000 in cash from their refinances resulting in a loan-to-value (LTV) ration of 66 percent.
The effects of the two hurricanes, Harvey and Irma, that hit the mainland last fall continue to be felt in national delinquency rates. Black knight says there were still 139,000 storm related delinquencies in February, 128,000 of which are now serious. While these are down from their peaks, they are still pulling rates upward. Without the hurricane effect 30-day delinquencies would by down 76,000 from last February rather than up by 63,000 and the 72,000 year-over-year increase would have been a 56,000 decline.
The non-current rate without the hurricanes would have approximated 4.67 percent; instead it is pulled higher by 27 basis points. The national serious delinquency rate is 25 basis points higher than it otherwise would have been.
Black Knight says it is clear that the lingering effects of the storms will be felt throughout the year, both in the areas directly affecting, and in the national delinquency picture.


