
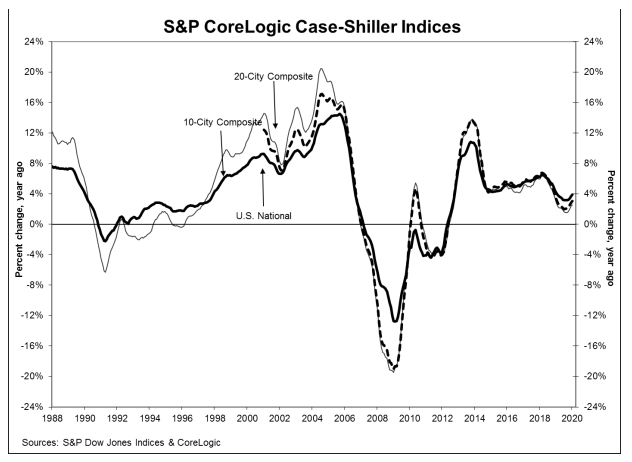
Home prices entered 2020 still on the uptick according to the S&P CoreLogic Case-Shiller indices. The U.S. National Home Price Index, which covers all nine U.S. census divisions, reported a 3.9 percent annual gain in January. The year-over-year increase in December was 3.7 percent. There was no monthly change in the non-seasonally adjusted (NSA) index from December to January, but after adjustment the National Index was up 0.5 percent.
The 10-City Composite Index posted a 2.6 percent annual gain, up from 2.3 percent in December and the 20-City Composite rose 3.1 percent, a 0.3-point greater increase than the month before. The 10-City measured eked out 0.1 percent monthly growth while the 20-City was flat on a non-adjusted basis. Both indices moved 0.3 percent higher after adjustment. Ten of the 20 cities posted monthly appreciation on an unadjusted basis, 18 of them did so when adjusted.
Seattle got back in the running after months of declining prices, tied with Tampa and San Diego as the second fastest appreciating metro areas with increases of 5.1 percent. All three lagged behind Phoenix which continued in the top spot with annual growth of 6.9 percent. Fourteen of the 20 cities reported higher price increases in the year ending January 2020 versus the year ending December 2019.
"The trend of stable growth established in 2019 continued into the first month of the new year," says Craig J. Lazzara, Managing Director and Global Head of Index Investment Strategy at S&P Dow Jones Indices. "The National Composite Index rose by 3.9 percent in January 2020, and the 10- and 20-City Composites also advanced (by 2.6 percent and 3.1 percent respectively). Results for the month were broad-based, with gains in every city in our 20-City Composite; 14 of the 20 cities saw accelerating prices. As has been the case since mid-2019, after a long period of decelerating price increases, the National, 10-City, and 20-City Composites all rose at a faster rate in January than they had done in December.
"At a regional level, Phoenix retains the top spot for the eighth consecutive month, with a gain of 6.9 percent for January. Seattle, Tampa, and San Diego all rose by 5.1 percent. Housing prices were particularly strong in the West and South, and comparatively weak in the Midwest and Northeast.
"It is important to bear in mind that today's report covers real estate transactions closed during the month of January. The COVID-19 pandemic did not begin to take hold in the U.S. until late February, and thus whatever impact it will have on housing prices is not reflected in today's data."
All three indices have surpassed their previous summer 2006 peaks. The National Index up 15.1 percent, and the 10-City and 20-City are 2.2 percent and 5.9 percent higher respectively. All three are at least 58 percent above the Great Recession troughs they hit in 2012.
The S&P CoreLogic Case-Shiller Home Price Indices are constructed to accurately track the price path of typical single-family home pairs for thousands of individual houses from the available universe of arms-length sales data. The National U.S. Home Price Index tracks the value of single-family housing within the United States. The indices have a base value of 100 in January 2000; thus, for example, a current index value of 150 translates to a 50 percent appreciation rate since January 2000 for a typical home located within the subject market.
As of January 2020, the National Index was at 212.43 compared to 212.59 in December. The 10- and 20-City Composites had readings of 231.27 and 218.62 respectively, compared to 231.55 and 218.73 the prior month. Los Angeles has the highest index at 289.80 and Cleveland the lowest at 126.34.


