
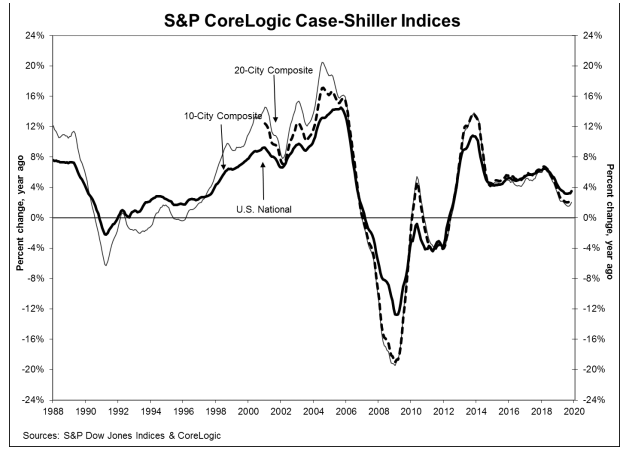
The recent re-acceleration of home price gains continued in November. The S&P CoreLogic Case-Shiller U.S. National Home Price Index which covers all nine U.S. census divisions, reported a 3.5 percent annual gain for the month, up from 3.2 percent in October. The growth rate of the indices had declined steadily throughout the year. The National Index had closed out 2018 with a 4.6 percent gain. That had dropped to 3.1 percent in August, then began to rise again.
The 10-City Composite annual increase came in at 2.0 percent and the 20-City Composite rose 2.6 percent from a year earlier. The annual gains in October were 1.7 percent and 2.2 percent respectively.
On a month-over-month basis the National Index increased 0.2 percent on a non-adjusted basis and was 0.5 percent higher after adjustment. Both composites rose 0.1 percent before adjustment and were also 0.5 percent higher on an adjusted basis. Thirteen of the 20 cities reported increases before seasonal adjustment and all 20 did so after adjustment.
Phoenix, Charlotte, and Tampa continued to lead the all 20 cities in price gains although Charlotte replaced Tampa in second place. Phoenix posted 5.9 percent annual appreciation while Charlotte's prices rose by 5.2 percent and Tampa's increased by 5.0 percent. Fifteen of the 20 cities reported greater price increases in the year ending November 2019 versus the year ending October 2019.
"The U.S. housing market was stable in November," says Craig J. Lazzara, Managing Director and Global Head of Index Investment Strategy at S&P Dow Jones Indices. "With the month's 3.5 percent increase in the national composite index, home prices are currently 59 percent above the trough reached in February 2012, and 15 percent above their pre-financial crisis peak. November's results were broad-based, with gains in every city in our 20-city composite.
"At a regional level, Phoenix retains the top spot for the sixth consecutive month, with a gain of 5.9 percent for November. Charlotte and Tampa rose by 5.2 percent and 5.0 percent respectively, leading the Southeast region. The Southeast has led all regions since January 2019.
"As was the case last month, after a long period of decelerating price increases, the National, 10-city, and 20-city Composites all rose at a modestly faster rate in November than they had done in October. This increase was broad-based, reflecting data in 15 of 20 cities. It is, of course, still too soon to say whether this marks an end to the deceleration or is merely a pause in the longer-term trend."
All three indices have recovered to levels surpassing those before the Great Recession. The National Index is 15.1 percent higher than its previous peak in the summer of 2006 while the 20-City is up 5.9 percent and the 10-City is 2.3 percent higher than their prior respective highs.
The S&P CoreLogic Case-Shiller Home Price Indices are constructed to accurately track the price path of typical single-family home pairs for thousands of individual houses from the available universe of arms-length sales data. The National U.S. Home Price Index tracks the value of single-family housing within the United States. The indices have a base value of 100 in January 2000; thus, for example, a current index value of 150 translates to a 50 percent appreciation rate since January 2000 for a typical home located within the subject market.
As of November 2019, the National Index was at 212.56 up from 212.43 in October. The 10- and 20-City Composites had readings of 231.45 and 218.68 respectively, compared to 231.16 and 218.43 the prior month. Los Angeles has the highest index at 289.17 and Cleveland the lowest at 127.67.


