(UPDATED AT 10:00AM)
The Commerce Department released November New Residential Construction: Building Permits, Housing Starts, and Housing Completions data this morning.
Housing Starts data estimates how much new residential real estate construction occurred in the previous month. New construction means digging has begun. Adding rooms or renovating old ones does not count, the builder must be constructing a new home (can be on old foundation if re-building). Although the report offers up single family housing, 2-4 unit housing, and 5 unit and above housing data, single family housing is by far the most important as it accounts for the majority of total home building.
Building Permits data provides an estimate on the number of homes planning on being built. It tracks how much future construction activity we can expect to take place. This data is a part of Conference Board's Index of Leading Economic Indicators.
In October, thanks to the "about to expire" FTHB tax credit and a rain filled month, housing starts fell 10.6% to an annual pace of 529,000 starts, their slowest rate in six months. Single family construction declined 6.8% while multi-family construction moved 34.6% lower. The more important, forward looking indicator...Building Permits, declined 4.0% on a month over month basis.
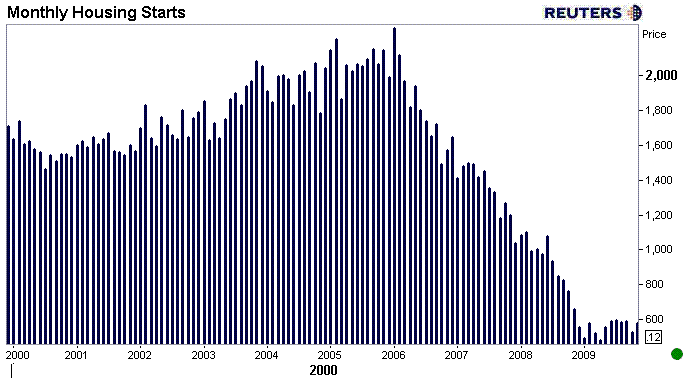
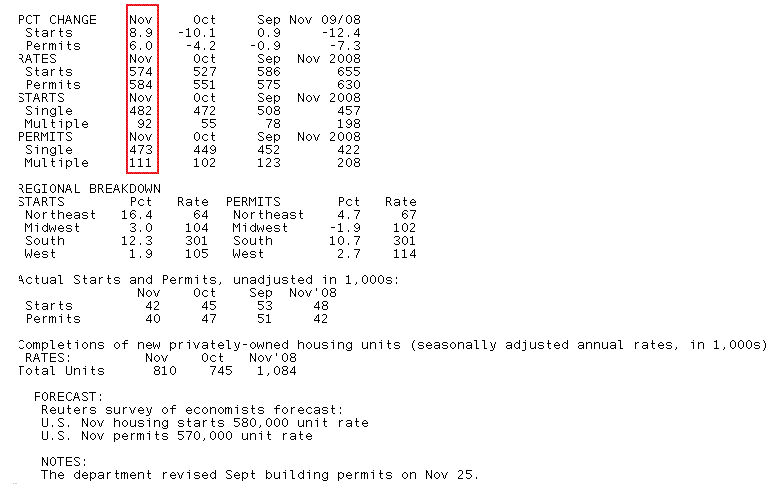
In today's release, which reported on November New Construction data, Housing Starts rose 8.9% to an annual pace of 574,000. This is worse than expected as economist had forecast an annual pace of 580,000 starts. October's read was revised from 529,000 annual starts to 527,000. This was the largest month over month gain since May.
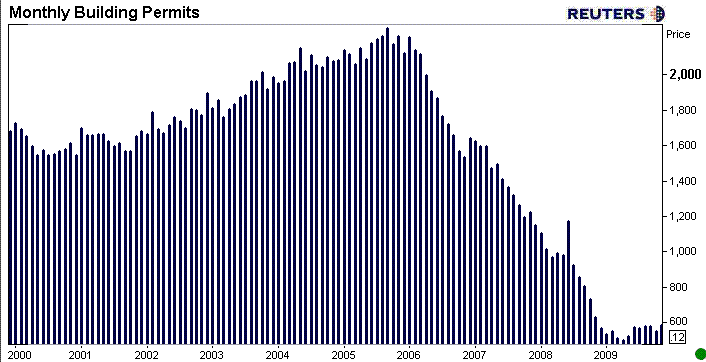
Building Permits improved 6.0% in November to an annual rate of 584,000 permits. This was better than expected as economists had forecast an annual rate of 570,000 permits. Building Permits are at their highest annual rate since November 2008 (630,000).
From the Commerce Department....
BUILDING PERMITS
Privately-owned housing units authorized by building permits in November were at a seasonally adjusted annual rate of 584,000. This is 6.0 percent (±1.6%) above the revised October rate of 551,000, but is 7.3 percent (±1.8%) below the November 2008 estimate of 630,000.
Single-family authorizations in November were at a rate of 473,000; this is 5.3 percent (±1.1%) above the revised October figure of 449,000. Authorizations of units in buildings with five units or more were at a rate of 86,000 in November.
In the chart below, while month over month headline gains are a positive for market sentiment, overall activity remains at VERY LOW levels.

HOUSING STARTS
Privately-owned housing starts in November were at a seasonally adjusted annual rate of 574,000. This is 8.9 percent (±10.2%)*above the revised October estimate of 527,000, but is 12.4 percent (±9.1%) below the November 2008 rate of 655,000.
In the chart below, while month over month headline gains are a positive for market sentiment, overall activity remains at VERY LOW levels.

Single-family housing starts in November were at a rate of 482,000; this is 2.1 percent (±9.2%)* above the revised October figure of
472,000. The November rate for units in buildings with five units or more was 83,000.
HOUSING COMPLETIONS
Privately-owned housing completions in November were at a seasonally adjusted annual rate of 810,000. This is 8.7 percent (±13.7%)* above the revised October estimate of 745,000, but is 25.3 percent (±10.1%) below the November 2008 rate of 1,084,000.
Single-family housing completions in November were at a rate of 524,000; this is unchanged (±11.7%)*compared with the revised October figure. The November rate for units in buildings with five units or more was 270,000.


