
Black Knight continues to review, in its new Mortgage Monitor, how the effects of nearly a year of lower interest rates have ricocheted throughout the industry. This month's Monitor looks both at loan data from October and from the third quarter of 2019.
Prepayments are still running at record high levels, increasing by what the company called "an eye-popping" 132 percent compared to the same time last year. The single month mortality (SMM) rate increased by double digit percentages for every one of the last 15 vintages of loans during September and October with some of the largest gains among loans originated during the housing bubble of 2005 to 2007.
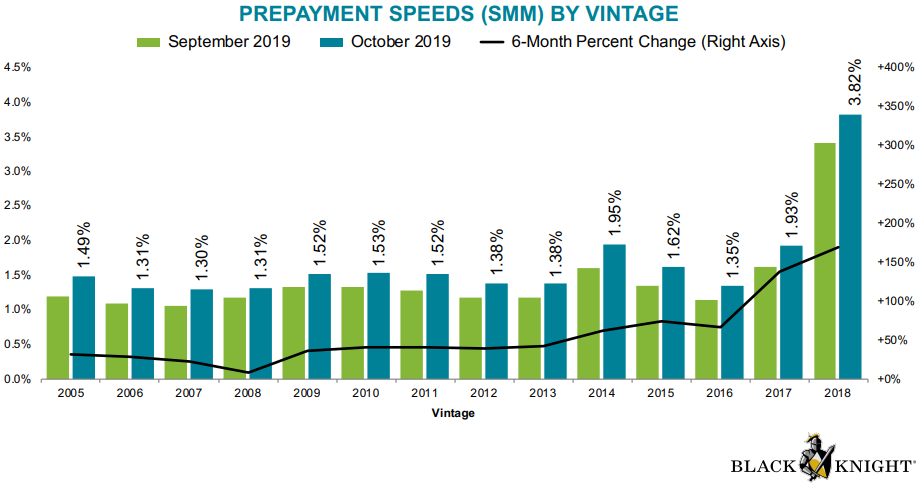
By product type, those loans guaranteed through GNMA (VA, FHA, USDA) once again had the highest payoff rate although they increased in October by the smallest amount, up 8 percent. Older loans in private label securities gained the most ground at 32 percent and the portfolio loan payoff rate went up 22 percent.

Due to increased prepayments and the booming refinance market, the 2019 vintage of loans originated to date now composes 17 percent of active mortgage loans.
While other factors, including payoffs from home sales, account for some of the prepayment rate, it is primarily refinancing which is driving its significant growth. Rate/term refinancing makes up 62 percent of the increase in prepayments and they are up 10-fold for the year to date (YTD). Cash-out refinancings account for another 21 percent.
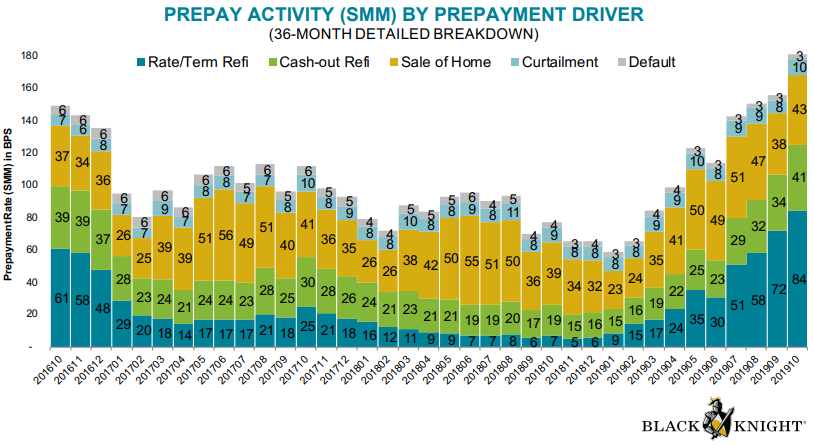
As the surging prepayments indicate, refinancing is at its highest level in nearly three years. Black Knight Data & Analytics President Ben Graboske explained, "After hitting an 18-year low in the fourth quarter of 2018, refinance lending has nearly doubled. The bulk of that increase was driven by people refinancing to improve the rate or term on their current mortgage, with five times the number of such rate/term refis as there were in Q4 2018."
As Black Knight has pointed out in earlier Monitors, many of last year's borrowers are already refinancing their loans. In the first and second quarters of this year 2018 vintage loans accounted for one of every five refinances and in the third quarter that share bumped up to nearly a third. Now even some homeowners whose loans were originated earlier this year are getting into the game.
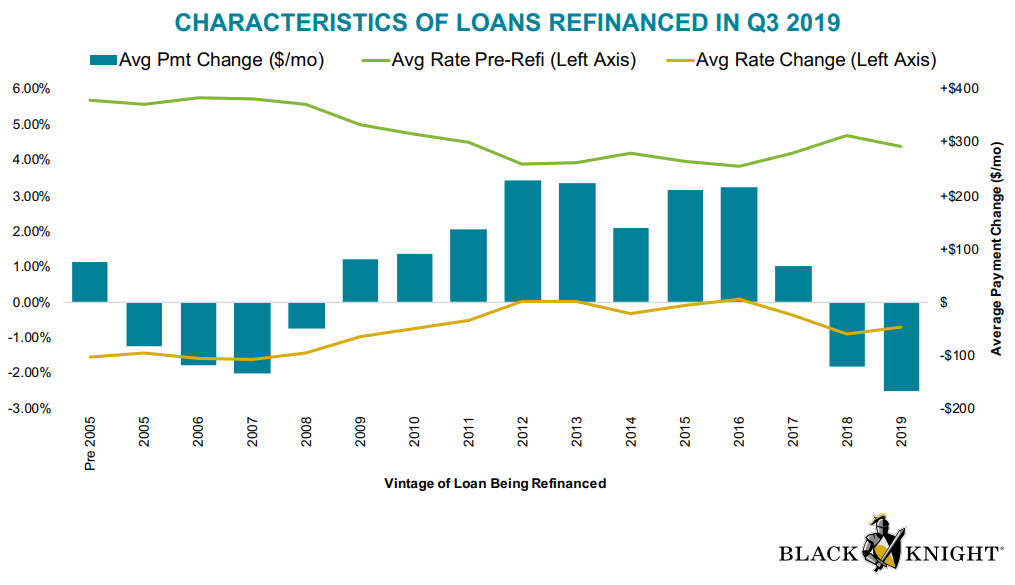
Borrowers who refinance newer vintage (2017-2019) mortgages tend to carry high balances (an average of $380,000 pre-refi for 2018 loans, $560,000 for those originated earlier this year) and were overwhelmingly refinancing for reasons of rate. Only around 20 percent of loans replacing those in 2018 and 2019 vintages were cash-outs as compared to 52 percent of all such loans.
Older loans that were refinanced carried much smaller balances; the 2008 to 2011 vintages had average balances of $160,000 to $172,000 and their replacement loans were heavily of the cash-out variety. Eighty percent of those refinances resulted in an equity withdrawal.
Those who refinanced 2018 and early 2019 vintage loans saw average rate reductions of 0.9 and 0.7 percent respectively. Those who refinanced loans originated in 2012, 2013, and 2016 actually accepted higher rates in order to tap equity and saw their monthly mortgage payments grow by $200. Many of those borrowers refinanced rather than take out home equity loans at a higher rate.
Black Knight looked at how servicer retention rates have fared amidst the surge in refinancing, and Graboske said the results were not positive. Despite the highest refinancing volumes in nearly three years, retention rates fell in Q3 2019. He said that, "Just 22 percent of borrowers stayed with their servicer post-refinance in Q3 2019. The business of nearly three of every four rate/term refinance borrowers - historically an easier segment to retain - was lost, with servicers retaining just 26 percent of borrowers, down from 29 percent in Q2 2019. Cash-out borrower retention was even more dismal, though, as servicers lost more than four out of every five borrowers post-refinance. That's the lowest retention rate among that segment in more than two years."

Retention rates among the 2018 loans remain the highest of any vintage, but the gap has narrowed, slipping from 35 percent in the first half of the year to 30 percent in the third quarter. This was the sharpest pullback of any vintage.
The company says that a retention strategy that targets borrowers with high balances and significant interest rate incentive, while perhaps effective for recent borrowers, would be widely ineffective in reaching those with 2009 to 2017 vintage loans. Those borrowers tend to carry lower balances and are motivated primarily by their desire to tap equity.
And that equity continues to grow. Black Knight looked at the current amount that is tappable, that is, the amount available to homeowners with mortgages before reaching a maximum combined loan-to-value (CLTV) ratio of 80 percent. That equity edged down in Q3, a change the company called seasonal, to $6.2 trillion. This is 1 percent less than the all-time high in the second quarter, but it continued to grow on an annual basis, up by 5 percent, the largest increase since late 2018. The average homeowner now holds $119,000 in tappable equity.
There are 45 million mortgaged homeowners with tappable equity and of those about 65 percent have current interest rates at or above 3.75 percent. This means (much like those 2011-2016 vintage borrowers discussed above) they can cash-out refinance at a similar or even better rate than they have today. On the other hand, home equity lines of credit (HELOCs) had average rates in the third quarter that were 2.9 percent higher than 30-year fixed rates. This was the largest delta between the two since the financial crisis
The Monitor concludes that, given the continued growth in tappable equity, servicers may do well by leveraging granular data to more effectively target and increase retention of cash-out borrowers


