Total home equity, not surprisingly, increased again in the second quarter of the year. CoreLogic's quarterly Homeowner Equity Insights report, which looks only at properties with one or more mortgages, puts the aggregate increase at $428 billion year-over-year, a 4.8 percent gain. The company says that 63 percent of residential properties have a mortgage.
"Home values have continued to rise in most parts of the country this year and we are seeing the benefit in higher home equity levels. The western half of the U.S. has experienced particularly strong gains in home equity recently," according to CoreLogic CEO and President Frank Martell. In July 2019, South Dakota and Connecticut were the only two states to post annual home price declines. These losses mirror the states' home equity performances during the second quarter as both reported negative home equity gains per borrower."
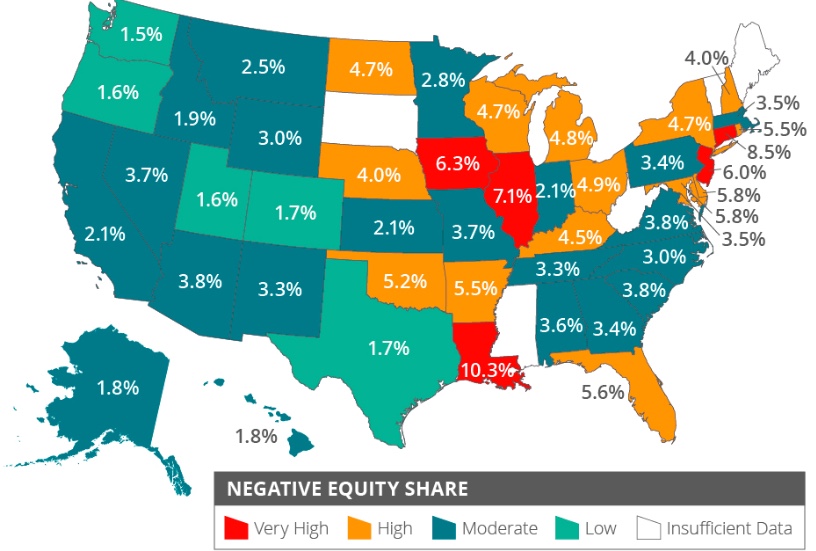
The number of mortgage properties that were underwater, owning more on the mortgage or mortgages than the property is worth, totaled 2 million homes or 3.8 percent of all mortgaged properties. This is 151,000 fewer underwater properties (a 9 percent decrease) from the second quarter 2018 total. At that time the negative equity rate was 4.3 percent.
Frank Nothaft, CoreLogic Chief Economist, said "Borrower equity rose to an all-time high in the first half of 2019 and has more than doubled since the housing recovery started. Combined with low mortgage rates, this rise in home equity supports spending on home improvements and may help improve balance sheets of households who could take out home equity loans to consolidate their debt."
Negative equity at the end of the second quarter of 2019 had an aggregate value of approximately $302.7 billion. This is down quarter over quarter by approximately $2.6 billion, from $305.3 billion in the first quarter of this year.
Negative equity peaked at 26 percent of mortgaged residential properties in the fourth quarter of 2009, based on the CoreLogic equity data analysis which began in the third quarter of 2009.
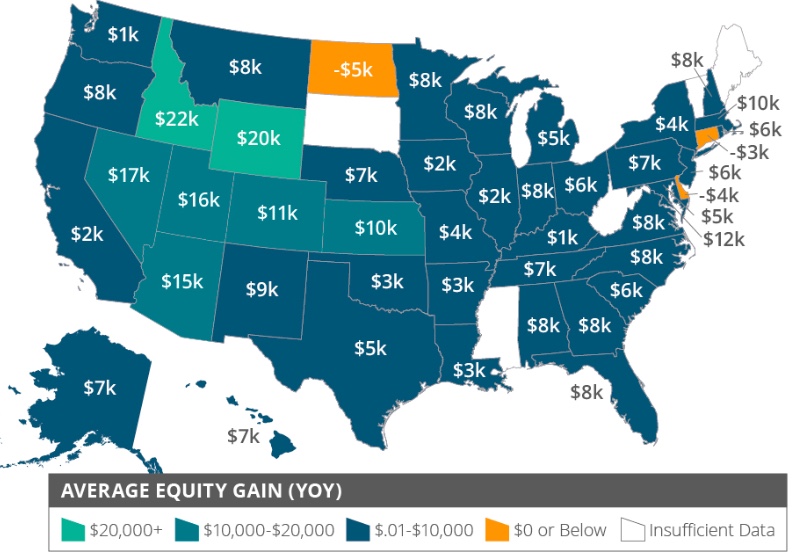
When broken down by household, the aggregate increase in equity averages a gain of $4,900 since the end of Q2 2018. Idaho had the highest year-over-year average increase at $22,100.