
Both the S&P CoreLogic Case-Shiller and the Federal Housing Finance Agency (FHFA) reported June price data on Tuesday. Both sets of indices showed the trend of decelerating prices continued into the summer, but appreciation in the FHFA index is still significantly more aggressive than the Case-Shiller and other major price measures.
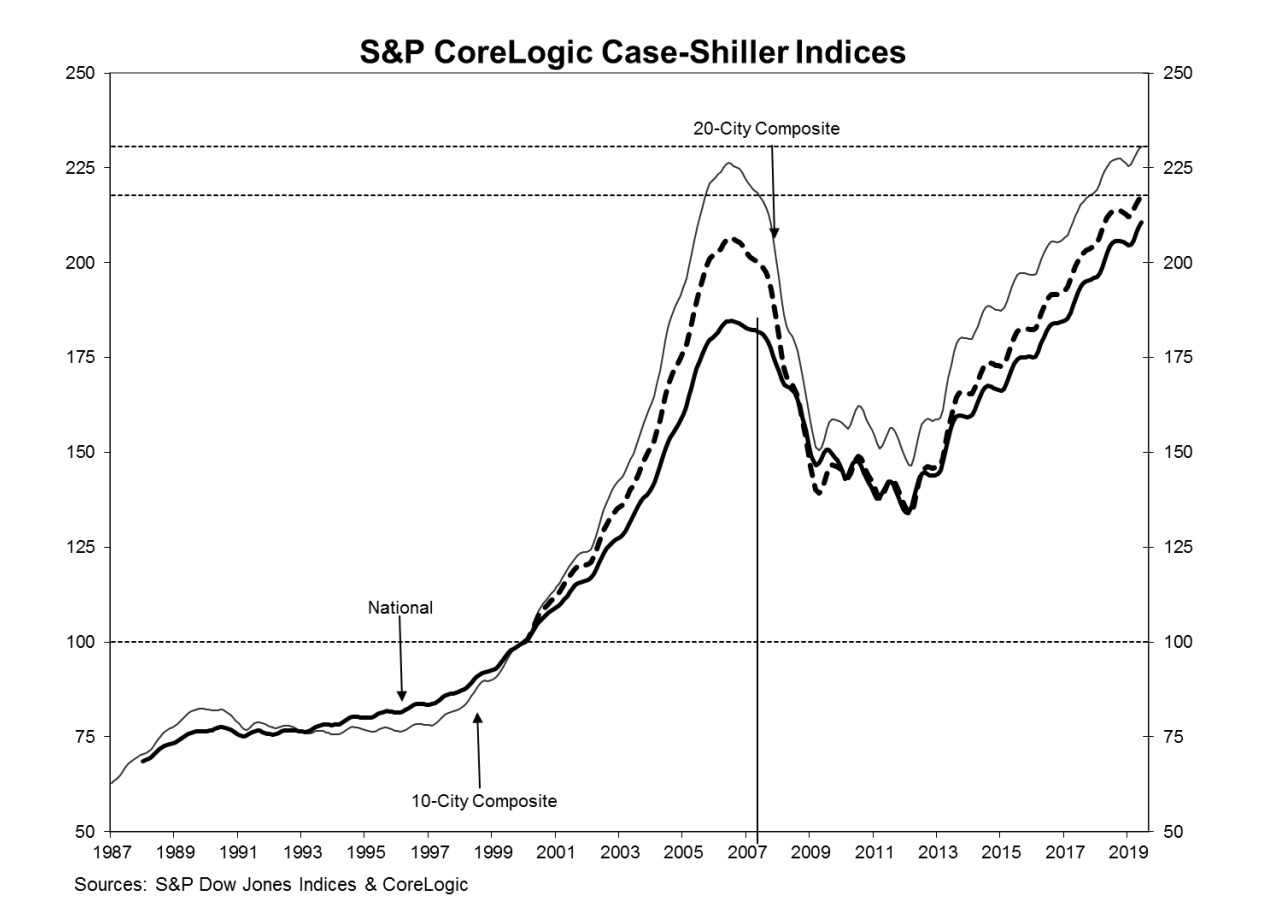
The S&P CoreLogic Case-Shiller U.S. National Home Price NSA Index, covering all nine U.S. census divisions, reported a 3.1 percent annual gain in June, down from 3.3 percent in the previous month. Before seasonal adjustment, the National Index posted a month-over-month increase of 0.6 percent with a 0.2 percent gain after adjustment.
The 10-City Composite annual increase came in at 1.8 percent, down from 2.2 percent in the previous month and the 20-City Composite's increase dwindled from 2.4 percent in May to 2.1 percent in the current report. Neither composite posted any monthly change after seasonal adjustment, but the 10-City had a 0.2 percent increase and the 20-City Composite a 0.3 percent increase from May on an unadjusted basis. In June, 19 of 20 cities reported increases before seasonal adjustment, while 17 of 20 cities reported increases after seasonal adjustment.
While the same three cities topped the list for annual gains as in the previous several months, Phoenix pushed Las Vegas out of its several year-long reign in the top slot. The Arizona city posted a 5.8 percent annual increase while Las Vegas was at 5.5 percent. Tampa occupied its customary third-place position with a 4.7 percent gain. Six of the 20 cities covered in the two composites reported greater price increases in the year ending June 2019 versus the year ending May 2019.
"Home price gains continue to trend down, but may be leveling off to a sustainable level," says Philip Murphy, Managing Director and Global Head of Index Governance at S&P Dow Jones Indices. "The average YOY gain declined to 3.0 percent in June, down from 3.1 percent the prior month. However, fewer cities (12) experienced lower YOY price gains than in May (13).
"The southwest (Phoenix and Las Vegas) remains the regional leader in home price gains, followed by the southeast (Tampa and Charlotte). With three of the bottom five cities (Seattle, San Francisco, and San Diego), much of the west coast is challenged to sustain YOY gains. For the second month in a row, however, only Seattle experienced an outright decline with a YOY price change of -1.3 percent. The U.S. National Home Price NSA Index YOY price change in June 2019 of 3.1 percent is exactly half of what it was in June 2018. While housing has clearly cooled off from 2018, home price gains in most cities remain positive in low single digits. Therefore, it is likely that current rates of change will generally be sustained barring an economic downturn."
All three indices remain above their pre-crisis peaks reached in the summer of 2006. The National Index is up 14.1 percent, the 20-City 5.4 percent, and the 10-City 1.9 percent. Each is at least 57 percent higher than when prices bottomed out in February and March 2012.
FHFA reported both June and second-quarter price changes in its current report. The agency's Housing Price Index (HPI) was up 0.1 percent in the second quarter compared to Q1. The year-over-year increase was 5.0 percent and prices rose 0.2 percent compared to May.
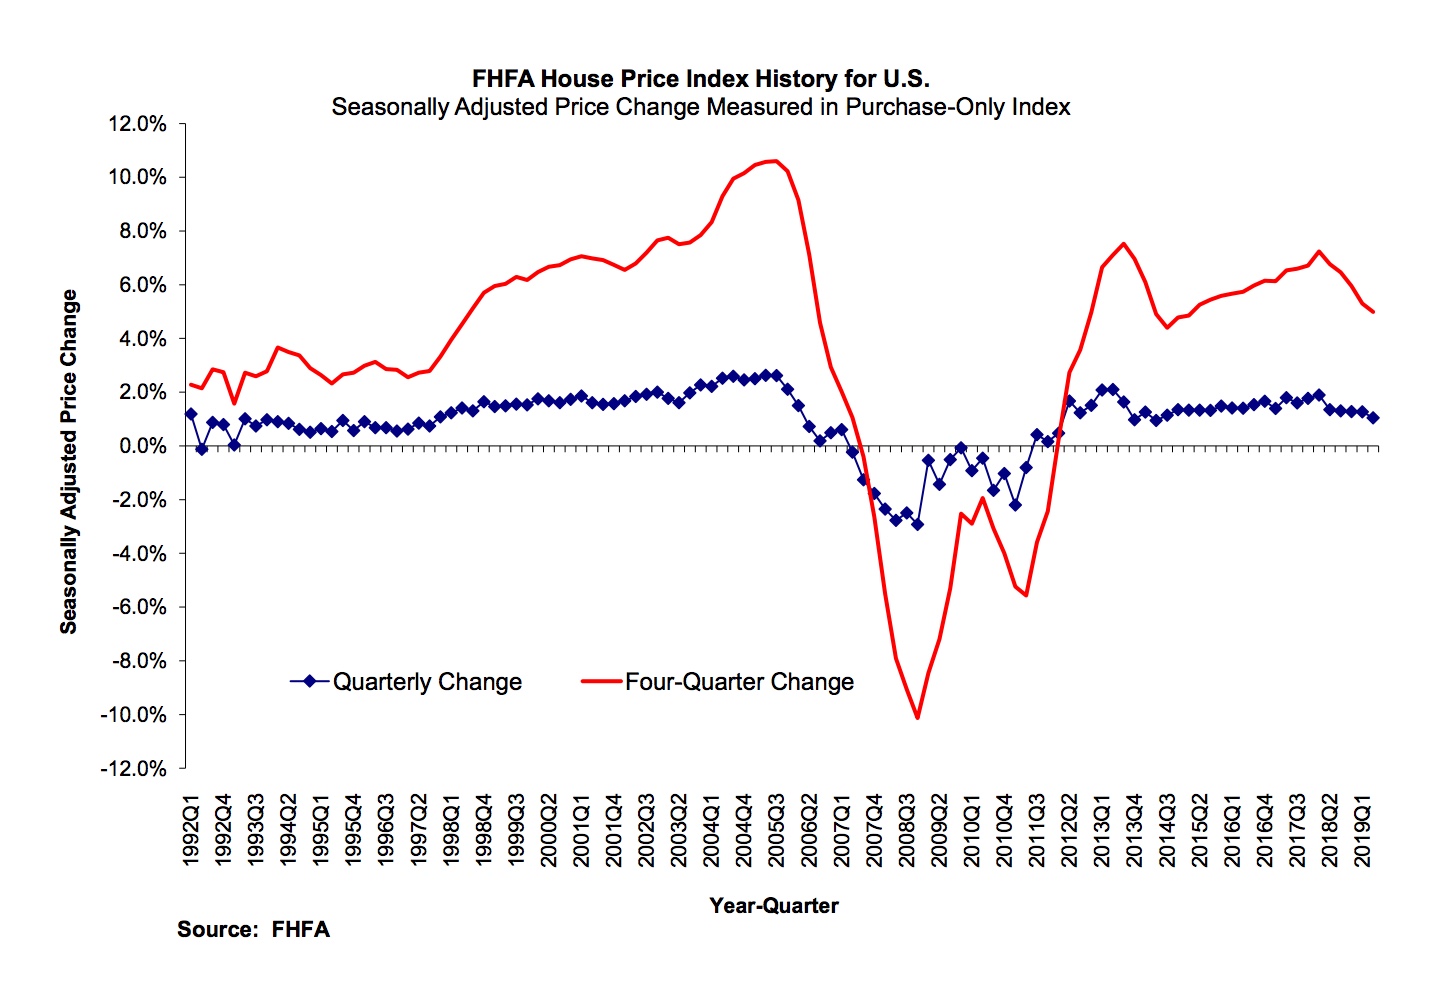
"House prices rose again in all states and the top 100 metro areas, but the pace of growth has slackened," said Dr. William Doerner, FHFA Supervisory Economist. "The majority of states and cities are experiencing slower house price gains than they did a year ago, even with constrained housing supply and extremely attractive mortgage rates.
FHFA says that home prices have now risen for 32 consecutive quarters nationwide and were higher in all 50 states and the District of Columbia between the second quarters of 2018 and 2019. Of the nine census divisions, the Mountain division experienced the strongest four-quarter appreciation, posting a 6.6 percent gain between the second quarters of 2018 and 2019 and a 1.3 percent increase in the second quarter of 2019. Annual house price appreciation was weakest in the Middle Atlantic division, where prices rose by 4.0 percent between the second quarters of 2018 and 2019.
Among the states, prices rose the most in Idaho, up 11.4 percent, Utah (7.7 percent), Tennessee (7.2 percent), Georgia (6.9 percent) and Arizona (6.9 percent).
FHFA's HPI is derived from sales prices of homes financed by mortgages purchased or guaranteed by Freddie Mac or Fannie May. The index was benchmarked at 100 in January 1991. The current index value is 275.6.
The S&P CoreLogic Case-Shiller Home Price Indices are constructed to accurately track the price path of typical single-family home pairs for thousands of individual houses from the available universe of arms-length sales data. The National U.S. Home Price Index tracks the value of single-family housing within the United States. The indices have a base value of 100 in January 2000; thus, for example, a current index value of 150 translates to a 50 percent appreciation rate since January 2000 for a typical home located within the subject market.
As of June 2019, the National Index was at 210.71 up from 209.66 in May. The 10- and 20-City Composites had readings of 230.58 and 217.65 respectively, compared to 230.12 and 216.94 the prior month. Los Angeles has the highest index at 287.16 and Cleveland the lowest at 126.01.


