
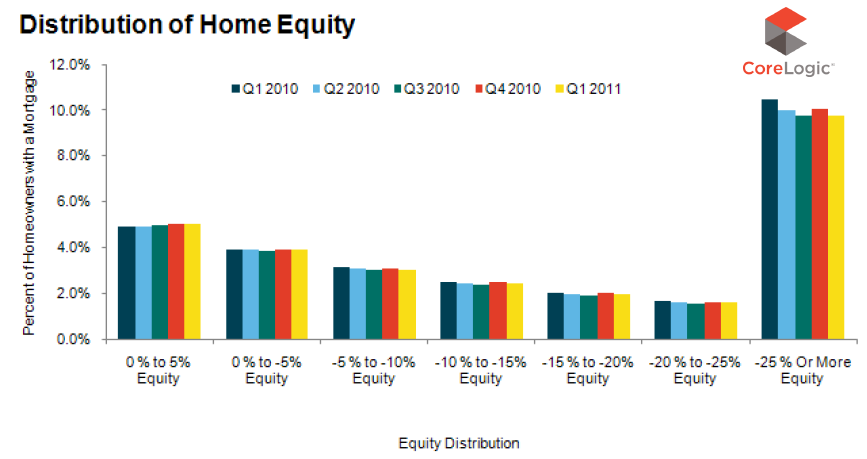
Approximately 22.7 percent of all U.S. homeowners were in a negative equity position with their mortgages at the end of the first quarter of 2011, down slightly from 23.1 percent in the fourth quarter of 2010.
In a report released Tuesday, CoreLogic states that some 10.9 million borrowers are "underwater", i.e. owe more on their mortgages than their property is worth and another 2.5 million borrowers (5 percent) were in a near-negative equity position, which the real estate data and analytics company defines as having less than 5 percent positive equity.
While the drop in housing prices caused much of the negative equity, equity extraction was also a key driver. Borrowers with second mortgages on their home were twice as likely to suffer negative equity as those with only one lien. 18 percent of borrowers without home equity loans were underwater while 38 percent of borrowers with home equity loans were in a negative position. A total of 4.5 million negative equity borrowers (40 percent) have home equity or other junior liens.
The current CoreLogic report does not attach a total dollar value to negative equity statistics but an analysis of the distribution of negative equity based on fourth-quarter 2010 numbers was published by the company last month which put the aggregate national net equity at $750 billion. The percentage of underwater borrowers has declined only 4 basis points since that time.
The negative position of individual borrowers is significant. The average underwater borrower owes $65,000 more than his property is worth. This number varies widely by state from a low of $31,000 in Ohio to $129,000 in New York. Not surprisingly, states that were among those with the biggest housing booms now report the largest negative equity averages; Massachusetts, $120,000; Connecticut ($111,000), Hawaii ($98,000), and California ($93,000). States which saw the smallest run-up of prices also have the lowest negative averages. In addition to Ohio those states are Indiana ($34,000) and Minnesota ($38,000.)*

Going back again to the May report on negative equity distribution, CoreLogic found that the $750 billion in negative equity that existed in the fourth quarter was distributed fairly evenly between properties with only one lien ($355 billion) and those with one or more junior liens ($395 billion). However, over 38 percent of first-lien only negative equity ($135 billion) was in properties valued between $100,000 and $200,000 as opposed to properties with more than one lien ($95 billion or 26 percent). At the higher end, 39 percent ($154 billion) of negative equity properties in the $300,000 to $700,000 range had multiple liens while 26 percent ($91 billion) had only one. In Q1 2011, the average negative equity for an individual with only one mortgage was $52,000 while a negative equity borrower with a 2nd lien was underwater by an average of $83,000.
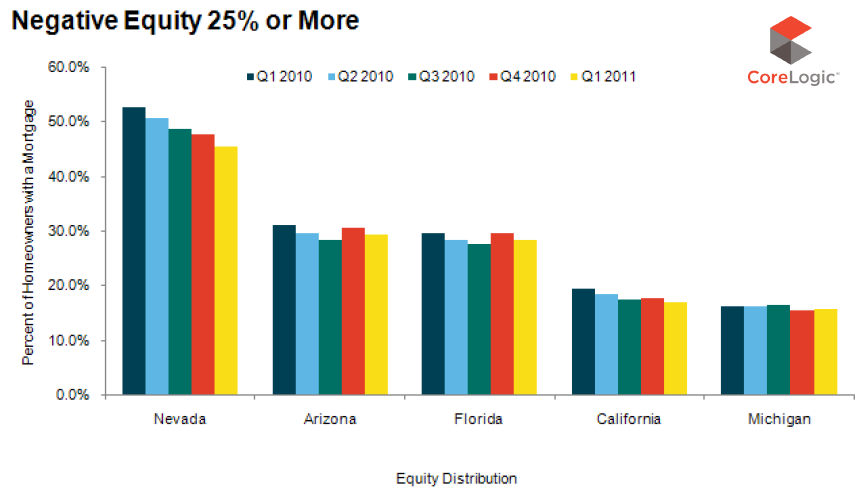
The states with the largest percentage of underwater borrowers were Nevada (63 percent), Arizona (50 percent), Florida (46 percent), Michigan (36 percent) and California (31 percent). These states account for a 40 percent share of the net negative equity and then they are excluded from the national figures, the percentage of underwater properties drops from 22.7 percent to 16 percent. The three hardest hit states did show slight improvement from the fourth quarter of 2010; Nevada was down 2.7 percentage points, Arizona fell 1.3 percentage points and Florida 1.3 percentage points.
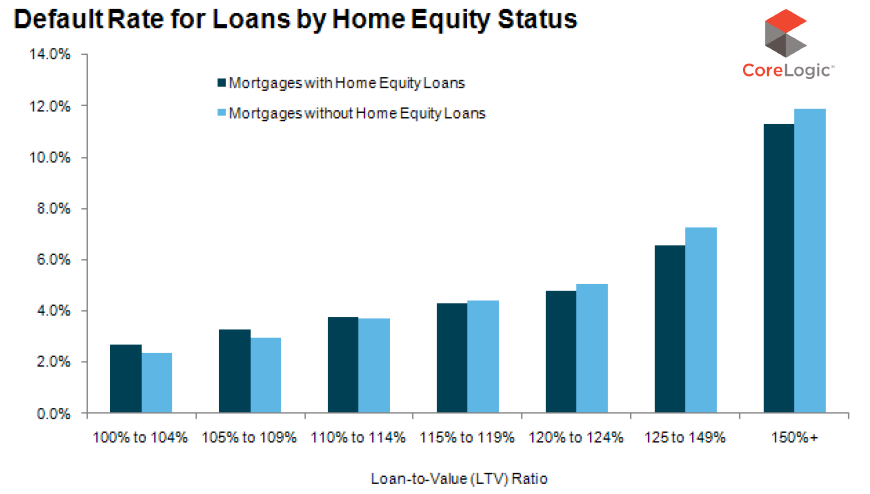
Default rates rise with the level of negative equity but not necessarily with the number of outstanding loans. At a low level - a CLTV under 5 percent - the default rate is slightly above 2 percent with multi-lien properties defaulting at a slightly higher rate than single lien properties. Above the 115 percent CLTV level where the default rate is 4 percent, single lien properties begin to default at a fractionally higher rate than multiple lien properties. Once the CLTV reaches 125 percent the default rate soars, reaching 12 percent at 150+ percent CLTV with single lien properties marginally higher than those with multiple liens.
"Many borrowers in negative equity are still able and willing to make their mortgage payments, Mark Fleming, CoreLogic's chief economist said. "Those in negative equity and impacted by an income shock of some kind, such as a job loss, divorce, or death, are much more likely to be at risk of foreclosure or a short sale. The current economic indicators point to slow yet positive economic growth, which will slowly reduce the risk of borrowers experiencing income shocks. Yet the existence of negative equity for the foreseeable future will weigh on the housing market recovery by holding back sale and refinance activity."
"This data is certainly cause for concern", says MND's Managing Editor Adam Quinones. "If home prices continue to fall, we'll be looking at another wave of strategic defaults".
READ MORE: Strategic Default: Inconceivable Assumptions Suddenly Conceivable
*Individual data was not given for seven states; Louisiana, Maine, Mississippi, South Dakota, Vermont, West Virginia, and Wyoming. We assume those states are also not included in aggregate national numbers.


