
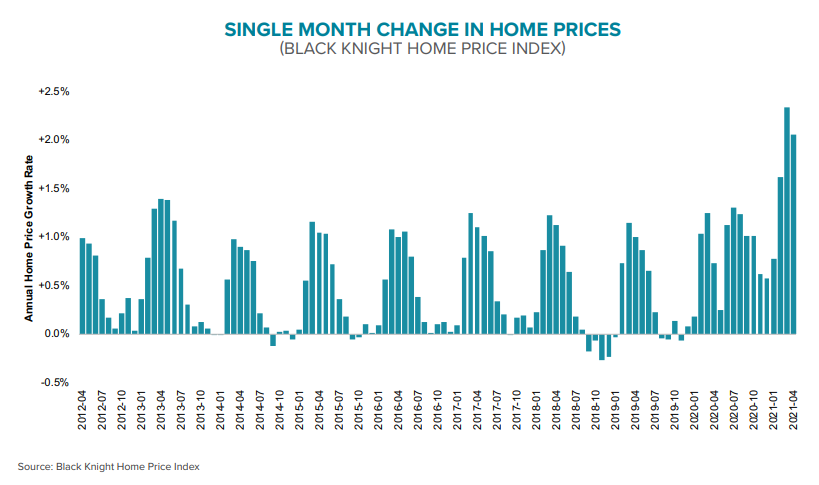
April price gains may have set a record for setting records and Black Knight, in its Mortgage Monitor for the month, runs them down.
- The annual rate of price increases , 14.8 percent, was the highest in the company's records dating back to the mid-1990s.
- Single-family prices rose even higher, 15.6 percent. Condo gains were significantly more restrained at 10 percent.
- April marked the 17th straight month of home price gains and they continue to accelerate sharply even as affordability is growing tight.
- Black Knight says before 2021 the largest single month increase was 1.53 percent in April 2004 and pre-2021 month-over-month appreciation exceeded 1.5 percent only two additional times in Black Knight's records (May 2004, and April 2005.) Price increases have broken through that barrier in each of the last three months, soaring to 2.34 percent in March. The April growth rate was 2.0 percent.
Nationwide there were few soft spots. Growth was again strongest in the western states. Arizona, Utah, Montana, and Washington all saw annual increases of over 20 percent, and Idaho led with a stunning 33.9 percent gain. Forty-four states had rates above 10 percent and a third were up 15 percent year-over-year. Six metro areas, Austin, Phoenix, Riverside (California), Seattle, Sacramento, and San Diego all clocked gains over 20 percent.
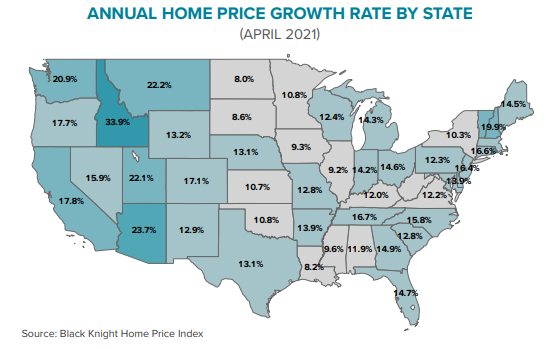
Even at the low end of the market the growth is impressive. Pittsburg had the slowest growth among the 50 largest markets, 8.1 percent. Black Knight said that's the highest "floor" it has seen in 25 years, three times higher than the prior record of 2.4 percent.
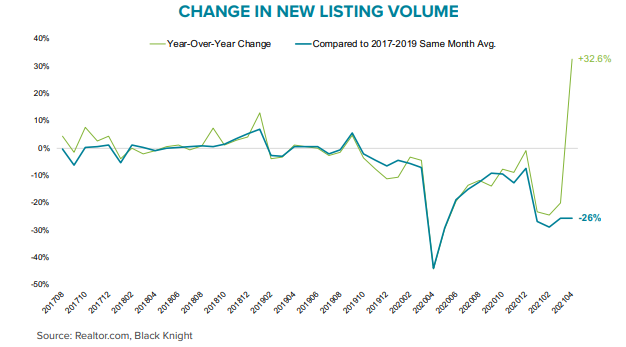
According to Black Knight Data & Analytics President Ben Graboske, "Driving this growth are two key elements: historically low interest rates and - more acutely - the lack of available for-sale inventory. The total number of active listings was down 60 percent from the 2017 to 2019 average for April.
"It's not getting any better, either. Data from our Collateral Analytics group showed there was two months' worth of single-family inventory nationwide in March, the lowest share on record and trending downward. In fact, there were 26 percent fewer newly listed properties in April as compared to pre-pandemic seasonal levels."
Further complicating matters, the number of active for-sale listings fell 53 percent in April compared to April 2020 and was 60 percent off the 2017-2019 average for April. There were one-third more new listings than a year earlier, although that comparison is to the month when the pandemic lockdowns were near their height. As a major of absorptions, new listings in April accounted for more than 75 percent of the total and the share is rising rapidly. All in all, the market is about 750,000 in the hole in terms of available homes for sale.
The price hikes have begun, and will and will likely continue, to create noticeable headwinds for both purchase lending and existing home sale volumes in coming months. It's already pushing home prices higher and impacting affordability.
As of the start of June, the share of the median income needed to make the monthly payments on the median-priced home had risen to 20.5 percent, surpassing the five-year average of 20.1 percent. While this is still more affordable than the 25-year average of 23.6 percent, Graboske notes "In recent years, 20.5 percent has roughly been the tipping point at which appreciation begins to decelerate, but given the severity of inventory shortages, home prices have - at least for now - continued to sharply accelerate even in the face of tightening affordability."

Black Knight says current levels of home price growth aren't sustainable for an extended period, especially if mortgage rates begin to rise. They looked at three sample scenarios of affordability if home prices continue their current pace in different interest rate environments.
If appreciation keeps up at its current rate and 30-year rates slowly rise to 3.5 percent by the end of 2022, the national payment-to-income ratio would hit 21.6 percent by the end of this year and 25 percent by 2022. With rates at 4 percent by the end of 2022, the ratio would hit 22 percent by the end of this year and 26.7 by the end of 2022.
If home values continued to rise at their current rate and 30-year rates rose to 4.5% by the end of next year, which the company calls still historically low, the payment-to-income ratio would rise to 22.5 percent by the end of this year and climb above 28 percent next year.
The company adds that tightening affordability may ultimately result in deceleration of home price growth from today's levels, but given the inventory shortages, this isn't a given.
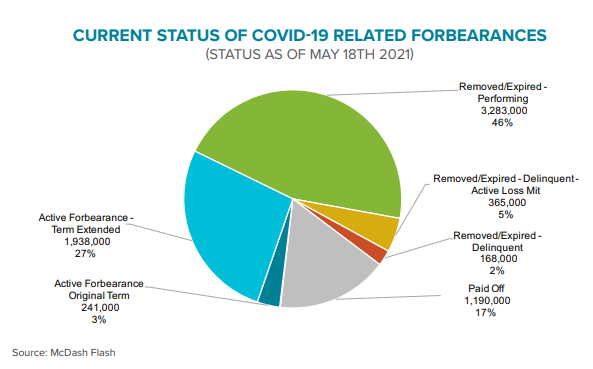
But there is a bright spot to this. The rising prices are limiting the number of equity-compromised loans in forbearance. Black Knight issues a weekly report on forbearances and as of June 1, 2.12 million loans remained in those plans after a 71,000 decline in the prior week. This is 4.0 percent of all active mortgages.
With limits on plan duration currently set at 18 months after several three-month extensions, Black Knight estimates that 1.1 million loans will reach their terminal expirations later this year. Even if the rate of improvement increases by 3.0 percent per month, there would still be 900,000 loans in the program when it ends. Even with several options provided reinstatement, significant unknowns persist regarding post-forbearance performance among long-term participants.
As of mid-May, 7.2 million homeowners had participated in forbearance, 70 percent of which have now left the program. Sixty-three percent of those former forborne borrowers are either reperforming or have paid off their mortgages through home sale or refinance. Another 5 percent are non-performing but in loss mitigation. Of 168,000 who have left the program and remain delinquent and not in mitigation, 110,000 were past due on their mortgages pre-COVID-19.
The aforementioned price gains continue to improve the equity positions of those who remaining in forbearance. Black Knight calculates that their mark-to-market combined loan-to-value (CLTV) ratios as of February give 96 percent of them at least 10 percent equity in their homes, typically enough to sell through traditional means, avoiding short sale or default. Even factoring in 18 months of arrearage puts only 13 percent of them below that 10 percent benchmark.
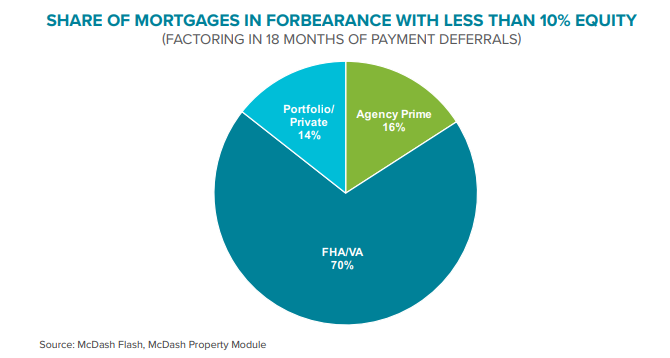
Most GSE and portfolio/PLS loans have over 10 percent equity, 99 percent, and 96 percent respectively, but of the 290,000 borrowers who, after factoring in past due payments, do not, more than 200,000 are in FHA or VA loans.


