
Black Knight's latest Mortgage Monitor report was released this morning and it provided more timely insight on home price appreciation than last week's home price indices (HPIs) from FHFA and S&P Case-Shiller. The Mortgage Monitor's price data covers February whereas the other HPIs were limited to January.
We already know that mortgage rates moved higher at a fairly brisk pace in January, but it was either too little or too late to make a difference in February's price appreciation. Black Knight recorded its highest year-over-year home price growth on record of 19.6%.

Notably, the annual growth rate was at least 10% in all of the nation's 100 largest markets for the first time on record, with the top five slots (Tampa, Austin, Raleigh, Phoenix, Nashville) all over 30%.

While these appreciation figures are very much in line with the other HPIs, the Mortgage Monitor goes a step further and compares price growth to other data. One of the two key pieces of additional data is the average mortgage payment associated with the average-priced home. After all, rates are lower now than they were at the last price peak in 2006. Nonetheless, the difference in prices has now more than offset the difference in rates.

Payment amounts only tell us so much about the current housing environment. Income has risen quite a bit since 2006. As such, the second key piece of data from Black Knight compares median incomes to average home prices to come up with a payment to income ratio. In other words, how much of the median family's income is needed to afford the average-priced home (20% down, 30yr fixed)?
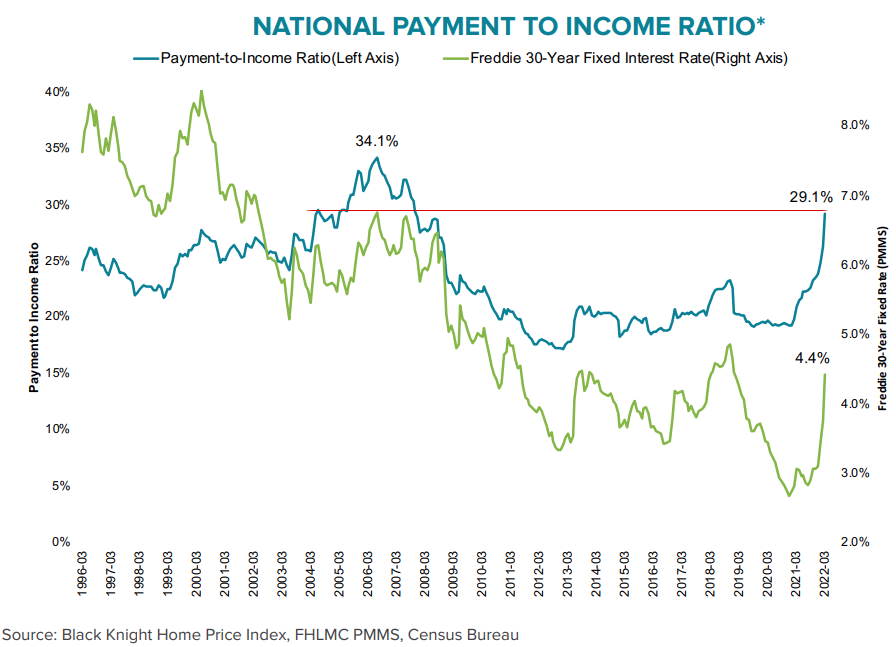
As the chart suggests, this ratio was only ever higher for a few years leading up to the mortgage meltdown and financial crisis of 2008. This isn't to suggest the same statistic will produce the same result in 2022 or 2023. There were variables in play back then that are not contributing to risks in the same way at present. Nonetheless, it does speak to affordability constraints playing more of a role from here on out.
As always, the Mortgage Monitor contains a wealth of other charts with interesting updates on the housing and mortgage markets. See the full report here.


