
Some time ago, Freddie Mac's Economic and Housing Research Group raised an alarm over a housing shortage, calling it a crisis and estimating that the country needs about 2.5 million additional housing units over the short to medium term to fill the gap. That was a national estimate. Now they are looking at conditions on the state level.
In its initial analysis Freddie Mac pointed out that over the 40 years preceding the housing crisis (1968-2008) 39 of those years saw more housing construction than did 2017 when 1.25 million units were completed. Things have not improved substantially since then. The Census Bureau reported that, in January 2020 the rate of unit completions was 1.28 million.
The poor post-recession recovery in housing production relative to population has been driven by an increase in development costs and shortage of skilled labor. The cost of land and conforming with regulations have averaged about 23 percent of total building expenses since the recession but can account for up to 70 percent of total costs in pricey markets. Regulatory costs are increasing, and the National Association of Home Builders (NAHB) says its members named labor shortages of one of their biggest business problems in 2019 and what they expect to be the biggest problem this year. Also constraining construction are factors such as NIMBY opposition and uneven demand as young adults flock to urban from suburban or rural areas. These restrictions are playing against a background of an estimated demand for 1.62 million housing units per year.
The current report says that, in accounting for state-level variations, they found the deficit is even greater in some states because housing is a fixed asset so, obviously, an abundance of housing in one area does nothing to make up a shortage elsewhere. They estimate that 29 states currently have a housing deficit and when only those states are considered the shortage grows to 3.3 million units
It is encouraging that the states with the most severe housing shortage are also those that have recently moved to loosen zoning policy regulations. California, for example, has been working to reduce single-use zoning while Texas recently amended the city code, loosening site restrictions and promoting construction of more units in affordable and mixed-income housing developments. Oregon and the Minneapolis City Council have moved to get rid of single-family zoning and the latter has started allowing buildings with up to three dwelling units in every neighborhood.
In its analysis, Freddie Mac used Census Bureau estimates of the total housing units in each state, including single-family homes, apartments, and manufactured housing and compared those totals to their own estimates of housing demand. They first focused on static estimates of housing demand, and then considered the impact of interstate migration.
If we can be forgiven for resorting to math, their demand projections rest on an estimate of long-term vacancy rates ( v* ). Their earlier analysis posited that a healthy market needs a degree of vacancies which they estimated at around percent. The second variable is an estimate of the target number of households ( h* ). Using the formula below will give an estimate of housing demand ( k * ).
k* = h*/v-1*Eq[1]
For the state analysis the economists used historical estimates of vacancy rates between 1970 to 2000 in each state as well as the state's share of the national housing stock to obtain the state weight, and then estimate the deviation of the state vacancy rate from the average national vacancy rate.
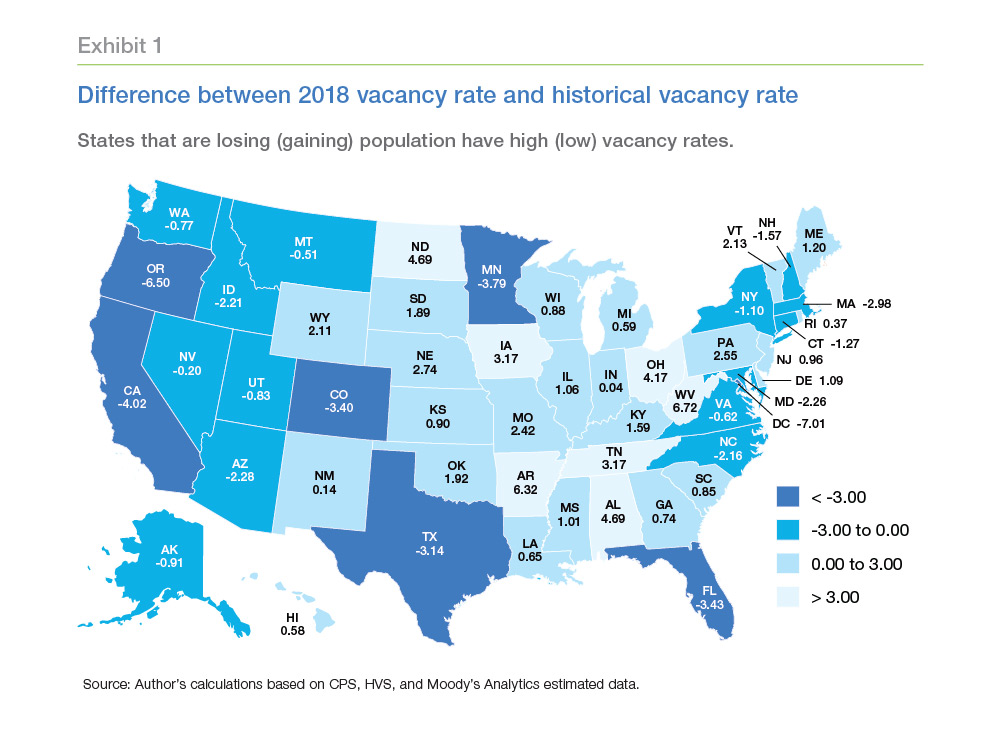
Historical vacancy rates vary dramatically by state. States like Vermont and Maine tend to have high vacancy rates because a large fraction of the housing stock serves as vacation/second homes. On the other hand, states like California tend to have very low vacancy rates.
They note that comparing the states long-term vacancy rate ( v * ) to recent estimates ( v ) reveals the number of housing units needed to close the gap between them as shown in Exhibit 1. States like Oregon, California, and Minnesota have much lower current vacancy rates compared to their historical averages, while states like West Virginia, Alabama, North Dakota, and Ohio have witnessed an increase in the vacancy rates as the populations of these states have decreased.
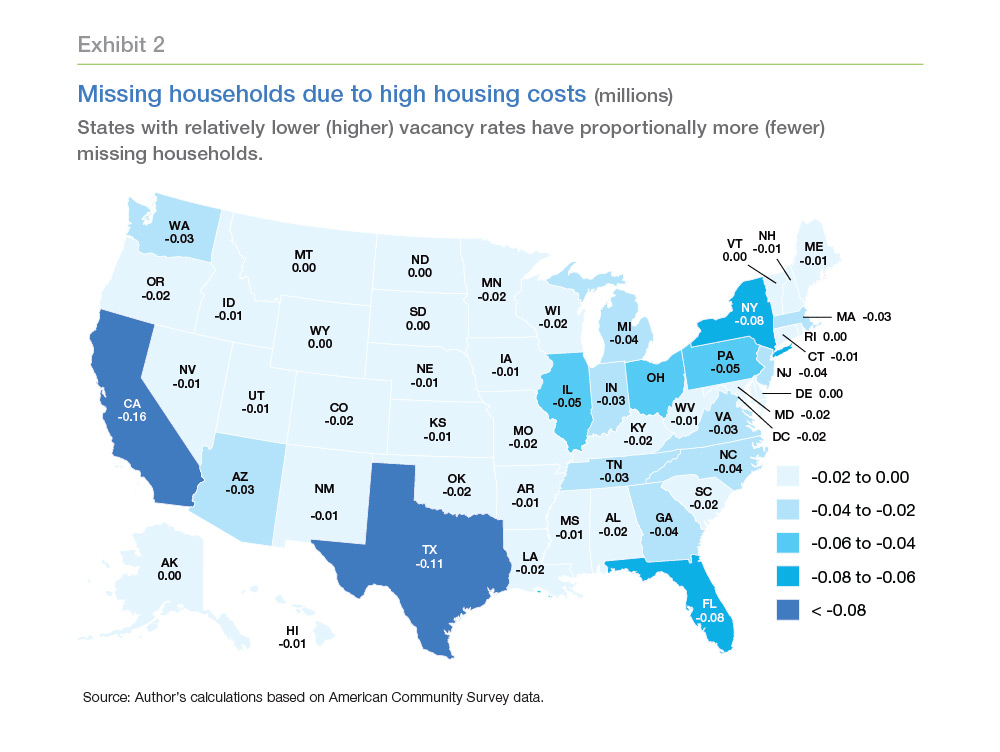
Previous research has shown that high housing costs have held back the formation of household and those costs have been especially hard on Millennials who have turned to sharing housing with roommates or living with parents. Freddie Mac estimates there are more than 400,000 missing households that would have been headed by heads aged 25 to 34 were it not for the high housing costs.
Other age groups have not been immune and Freddie Mac's model estimates the reduction in households for each age group, adding them back in. Because age profiles vary by state, so does the share of missing households, as shown in Exhibit 2. In general, states with relatively lower vacancy rates have proportionally more missing households.
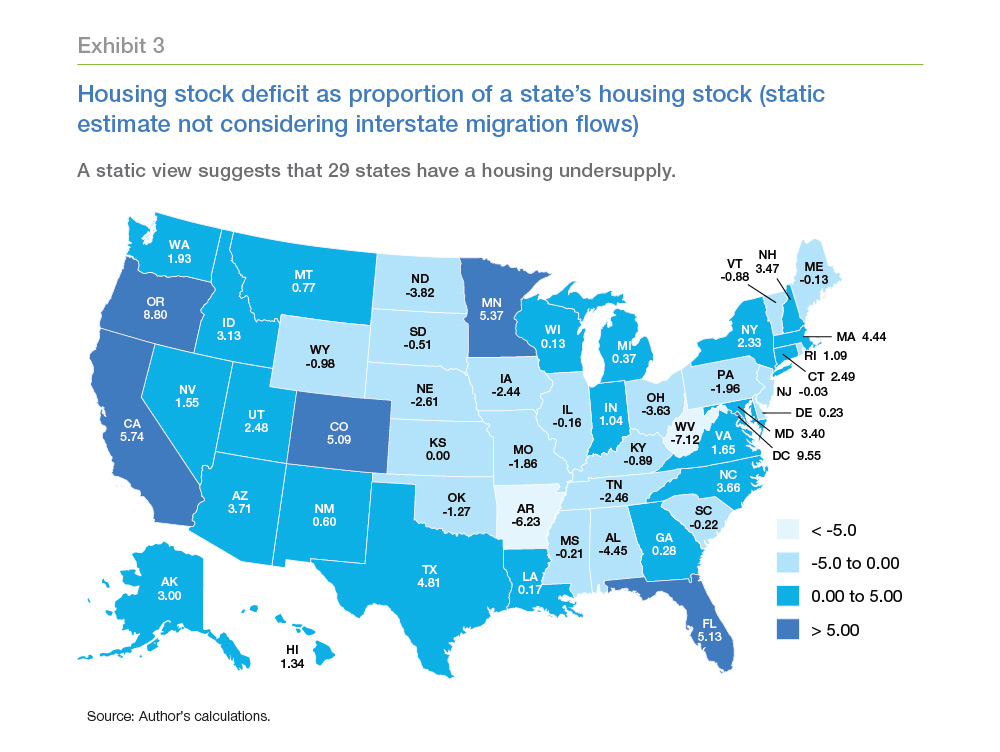
Combining the target vacancy rate and the target number of households results in estimated housing demand and subtracting that from the Census estimate of housing supply gives the estimated housing deficit. Exhibit 3 gives those results by state.
As a percent of the housing stock, the state housing supply deficit varies from -7 to 10 percent. Excluding the District of Columbia, Oregon has the largest deficit, nearly 9 percent, and California is almost 6 percent. Negative numbers mean the state is oversupplied. Twenty-one states are oversupplied, the largest being West Virginia, at more than 7 percent.
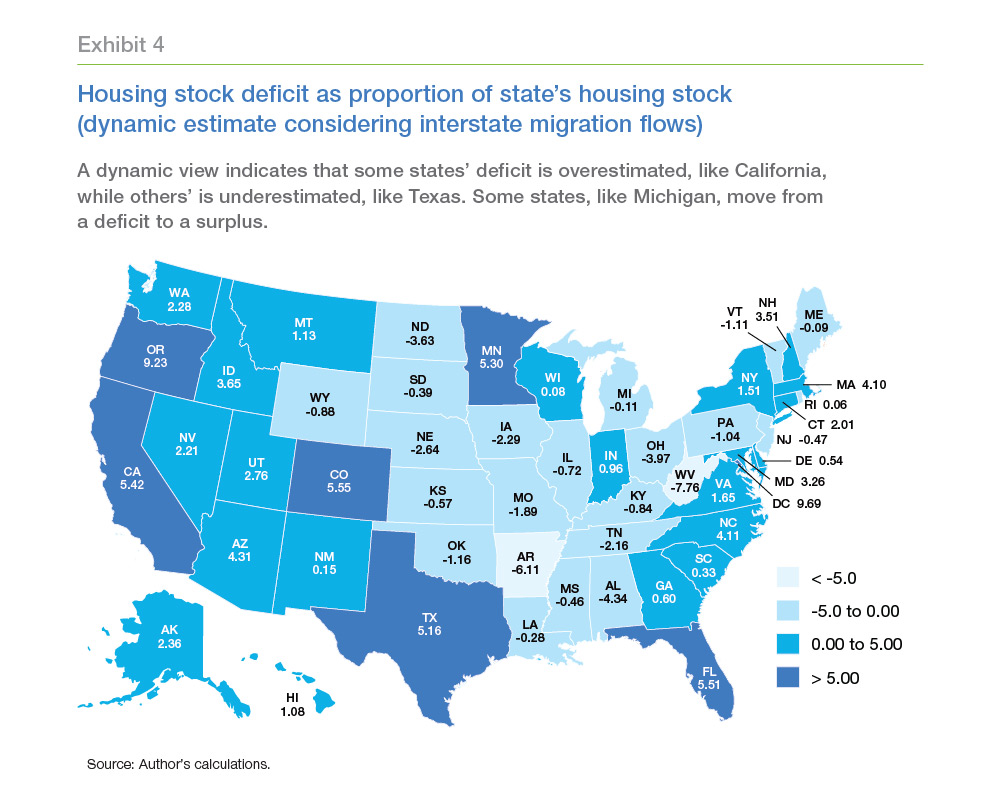
Of course, as the analysis points out, houses stay in place, people do not. Job growth attracts in-migrants, while a dearth of opportunity drives out-migration. High housing costs also contribute to migration patterns. When the rents get too high, people move away which can impact target estimates.
California is a good example. The analysis indicates a shortage of 820,000 housing units in the state, but this may be an overestimate if migration is considered. The state's population has grown for more than four decades, but the increase has been driven primarily by international migration while housing costs have driven many U.S. citizens and households out of California, to drive demand higher in their destination states.
While modeling domestic migration flows is beyond the scope of its current study, Freddie Mac did approximate how migration might affect their estimates, using historic averages (since 2001) to forecast future ones. For example, if the future is an exact match for the past, the estimated housing demand in Michigan changes from deficit to surplus; Ohio's surplus increases; and Florida's deficit increases.
The economists conclude that a shortage of housing remains a major issue for the United States. Years of underbuilding has created a large deficit, particularly for states with strong economies that have pulled in residents from other states. The issue of undersupply will be further exacerbated as Millennials and younger generations enter the housing markets, especially as housing costs become more favorable.
Dynamic estimates suggest that contrary to expectations, it isn't only the larger states that have a higher housing supply shortage. Some of the smaller states, which have been attracting a lot of migrants from other states, also need to build more housing units to accommodate the needs of their growing population.


