
CoreLogic is continuing its analysis of the potential impact of the January 2021 expiration of the so-called "GSE Patch." Under the Consumer Financial Protection Bureau's (CFPB's) 2013 Ability-to-Repay (ATR) and Qualified Mortgage (QM) Rules, lenders must make a reasonable, good faith determination of a consumer's ability to repay a mortgage loan based on verified financial information generally associated with responsible mortgage lending practices. In most cases, meeting QM requirements provides lenders with a safe harbor from the Rules' legal liabilities. Lenders who fail to comply can be held liable for damages by both the CFPB and the homeowner. The Patch provides a temporary category under ATR and QM rules under which loans eligible for purchase or guarantee by the GSEs Fannie Mae and Freddie Mac can qualify as QM loans.
Mortgage loans tend to fall into one of the following compliance categories:
- QM Safe Harbor loans are foundational mortgage products (e.g., 5/1 ARM and 30-year fixed) that are generally considered to have sustainable borrower repayment features.
- QM Rebuttable Presumption loans generally have higher Annual Percentage Rates (APRs) than Safe Harbor loans and require extra steps by lenders to ensure borrower repayment sustainability.
- Non-QM loans are more complex mortgage loans, such as negatively amortizing mortgages.
In Part 1 of the series, CoreLogic's Pete Carroll estimated about 16 percent or $260 billion of 2018 mortgage loan origination volume was QM-eligible due to the GSE Patch. In the second installment Archana Pradhan reviewed borrowers age, income, employment type and home sales price in the high Debt-to-Income (DTI) group. She found the youngest and the oldest borrowers and those with non-traditional income sources would be hardest hit by the expiration. In Part 3 she focused on borrower race/ethnicity and income categories, and those borrowers who bought properties in low-income and minority neighborhoods.
In this fourth part both analysts look at balancing risks (loan delinquency) and benefits (mortgage credit access) in the QM Safe Harbor. They analyzed merged CoreLogic Loan-Level Market Analytics (LLMA) data with Home Mortgage Disclosure Act (HMDA) data, creating a cohort of home purchase loans originated between 2010-2017. Performance of these loans was tracked as of October 2019.
Conventional loans are not insured or guaranteed by a federal government program and include both GSE conforming and non-conforming products. As was noted earlier in this series, those loans are deemed QM Safe Harbor if they have an APR less than the Average Prime Offer Rate (APOR) plus 1.5%. APOR is a weekly market index of the average Conventional loan APRs offered by a selection of lenders across several mortgage products. The difference between a loan's APR and the APOR is referred to as the "rate spread."
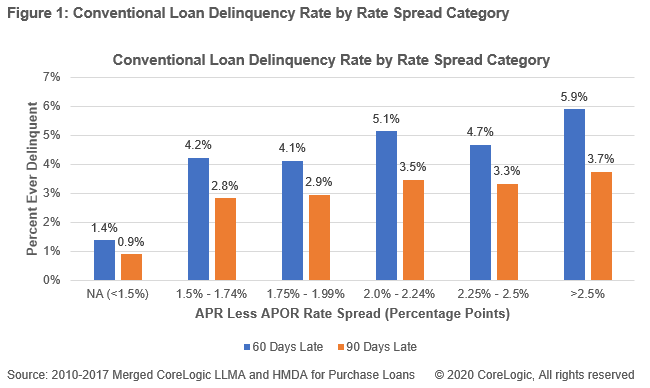
CoreLogic found that, as the rate spread increased, so did the delinquency rate. At a rate spread below 1.5 percent, the share of loans that have ever experienced a 60-day delinquency was 1.4 percent while at a spread of 1.5 percent or more it was 4.1 percent or higher. There was little distinction in loan delinquencies between the 1.5 percent and 1.74 percent and the next higher (1.75-1.99 percent) rate spread category, suggesting a relationship between loan pricing and borrower repayment sustainability for Convention loans. This warrants further study.

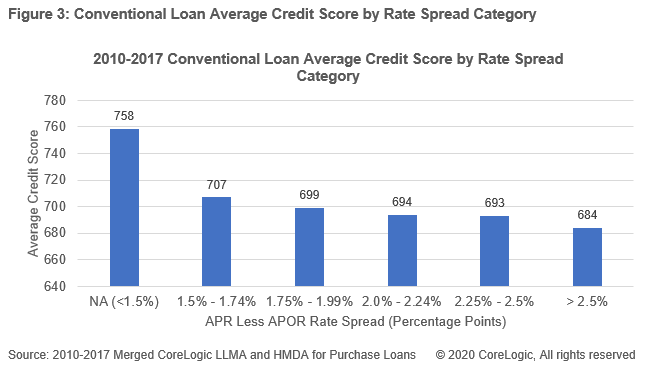
Loan pricing of course is not the only aspect of borrower sustainability and the authors looked at the relationships between rate spreads, and ability to repay and both the debt-to-income (DTI) ratio and credit scores. The quality of both DTI and credit scores among Conventional loan borrowers tracked almost completely in line with loan performance across all rate spread categories That is, as underwriting attributes deteriorated, the rate spread (loan pricing) and borrower loan delinquency both increased. The authors say the results merely reinforce the importance of borrower ability-to-repay-specific underwriting policies when defining a new ATR/QM Rule following expiration of the GSE Patch.
While the first three graphics show the risks of increasing the rate spread cap for QM Safe Harbor Loans, Figure 4 seeks to offer insight into the potential mortgage credit access for borrowers. Between 2014-2018, about 627,000 more first lien, purchase loans in the 1.5 to 1.99 percent rate spread category were originated by the government programs rather than under Conventional auspices. Conventional loans in this rate spread category are deemed QM Rebuttable Presumption loans, while FHA, VA, and RHS loans are deemed QM Safe Harbor. This difference or delta represents 3 percent of the rough total of 20.9M first lien, purchase loans originated over that time period.

While it isn't clear how many of those government loans might have been Conventional during this period had they been deemed QM Safe Harbor, Pradhan and Carroll say it stands to reason, given the outsized market share of QM Safe Harbor loans overall, that a more permissive cap such as FHA's APOR plus 2.0% (along with the lack of an APOR cap in the VA and RHS programs altogether) would have increased Conventional mortgage credit access for the 935,000 FHA applicants in this rate spread category, particularly when compared to the QM Rebuttable Presumption compliance status for Conventional loans in this same rate spread category (308,000 loans).
The writers conclude that policymakers will have difficult judgment calls to make when striking a balance between borrower repayment sustainability and mortgage credit access as the Patch disappears. All things equal, do the benefits of incremental mortgage credit access resulting from an increased QM Safe Harbor rate spread cap for Conventional loans outstrip the risk of increased loan delinquency rates for Conventional loan borrowers? What is the proper role for ability-to-repay-specific underwriting criteria in a new ATR/QM Rule? These judgments become particularly relevant in the event the economy experiences a recession, placing upward pressure on delinquency rates.
Part 5 in this series will use 2018 merged CoreLogic Loan-Level Market Analytics (LLMA) and HMDA data to allow a more granular analysis and uncover additional insights.


